Last Updated on December 18, 2021 at 10:49 pm
Since we cannot change the way the stock market operates all we can do is to make sense of its returns and invest wisely.In this post I use Sensex data to understand the nature of its fluctuating returns (including dividends!). The Excel sheet attached which will be of interest and utility to all investors regardless of experience/expertise.
To say that many investors are sacred of the stock market is an understatement. Many already invested in stock and mutual funds are worried about seeing their investment value in the red for months together. Many who consider equity investments stay away when they see the Sensex plunge a few hundred points every other day.
The main reason for this fear and apprehension is fluctuating stock returns. This fear haunts everyone, from newbie investors to even ones holding good stocks or mutual funds. Understanding the nature of these fluctuating returns (or volatility) is crucial for disciplined investing. Volatility is a double-edged sword. It is essential to produced returns that beat inflation over a long period of time. Unfortunately too much of it too often will kill the power of compounding.
Before we proceed, the difference between risk and volatility must be emphasized. Risk either refers toloss of capital or loss of value (due to inflation). Volatility refers to fluctuating returns. When you invest for a short term goal you cannot afford volatility in your portfolio leading to loss of capital. When you invest for a long term goal you have a choice:
Join over 32,000 readers and get free money management solutions delivered to your inbox! Subscribe to get posts via email! 🔥Enjoy massive discounts on our robo-advisory tool & courses! 🔥
- If you do not want loss of value risk then you MUST embrace volatility in return. This by its very nature will lead to short term loss of capital. You will have to get used to it!
- If you cannot stomach short term loss of capital risk you stay away from volatility in return and therefore you embrace loss of value risk. This is even more worse!
- In plain English: If you don’t want inflation to erode the value of your money invest in stocks (or MFs), get used to fluctuating returns and stay invested.
The first step: quantifying fluctuating returns: Consider a good old FD offering a return of 10% (compounded annually). If I invest Rs. 100 in this for 3 years my money will compound in the following way:
End of year 1: I get 100 x (1+10%) = 110
End of year 2: I get 110 x (1+10%) = 121
End of year 3: I get 121 x (1+10%) = 133.1
Fantastic! Now what is the ‘average’ rate of return? The answer that begs to be heard is 10%! Our mind automatically calculates (10%+10%+10%)/3 =10%. To check if this answer is correct we calculate: 100 x (1+r)3 = 133.1. This is the simple compound interest formula. Here r =10%, the ‘average’ return we have calculated. Thus our answer matches with the final obtained after 3 years and is no doubt correct. However this method of calculating average return is not applicable for all situations.
I invest Rs. 100 in an equity mutual fund and get the following sequence of returns: +10%, -10% and 25%. My money would have compound the following way:
End of year 1: I get 100 x (1+10%) = 110
End of year 2: I get 110 x (1-10%) = 99
End of year 3: I get 99 x (1+25%) = 123.75
If I calculate the ‘average’ return it is: (10%-10%+25%)/3 =8.33%. When I cross check the answer: 100 x (1+8.33%)3 = 127.14.
This answer is quite different from the actual value of 123.75. The key takeaway is: the moment returns vary from year to year the usual formula for average (r1+r2+r3)/3 (also known as arithmetic average or AM) does not work. We need an alternative way to compute the average.
The alternative average known as the geometric average is given by
r = [(1+r1) x (1+r2) x (1+r3)] (1/3) -1.
Here r1,r2, and r3 are interest rates for each year. When compounding is involved, the geometric average (GM) is referred to as CAGR (compounded annual growth rate). For the 3 year equity investment, r(GM) = 7.361%. When I plug this into the compound interest formula, I get, 100 x (1+7.361)3 = 123.75, the correct value.
The GM formula will work for all situations that involve compounding. For the FD investment, r1 =r2 = r3 =10% with GM of 10%. When returns are constant each year, AM = GM. When returns vary year AM will always be greater than GM. Therefore the difference between AM and GM can be used as a measure of volatility (for a more precise definition you could consult this resource). So let us define volatility = AM – GM. Higher the difference, higher the volatility.
To get a sense of stock market volatility, we compute the difference between AM and GM with Sensex returns over say, 3, 5, 7,10,12,15,20 and 25 year periods. Since there are many 3 year periods from 1978-79 (base year) to 2012-13, we roll over the 3 year period. That is we first calculate the 3 year AM and GM for financial years (FY) 1, 2 and 3 and move onto FY 2,3,4 and then to FY 3,4,5 and so on. We then average (arithmetically!) the AM and GM values over all 3 year periods. This is also done for other durations.
The average volatility (AM – GM) for 10,12,15,20 and 25 year periods is approximately 10%. The volatility is 9% for 7 years, 8.5% for 5 years and 7.3% for 3 years. Thus regardless of when we measure and regardless of how long we measure it for, the volatility of the market is nearly constant! It is incorrect to think that the market has behaved differently for last few years only. It has always behaved the same way! So there is no right or wrong time to invest – only the right or wrong investment.
The 15 year average rolling return of the Sensex is a number used by financial experts to convince people that time in the market is important. They say that the stock market has given impressive returns over 15 year periods and that the probability of losing money is zero. What do these statements really mean?
To understand this, we first look at the 3 year average GM. This is 18.4%, a fantastic rate of return. Unfortunately the standard deviation (a measure of how much individual returns that make up the average deviate from the average) is 20.9%. This means that if I consider 100 stock marker investors about 68 of them will have returns ranging from 18.4% –20.9% to 18.4% + 20.9%. A fancy way of saying that if you are in the market for only 3 year your returns could basically be anything!
Now consider the 15 year average GM(CAGR). This is 15.8%. The standard deviation is 5.4%. So now 68 out of 100 investors who have stayed invested for 15 years will have returns ranging from 15.8% – 5.4% to 15.8% +5.4%.
Notice that because of a lower standard deviation the fluctuation in return is much, much lower. In other words, when it comes to the stock market time is return! The longer you stay the lower your returns are likely to fluctuate. If you don’t say invested it is very likely that you will loose not only money but also the opportunity to invest when the market hits a low.
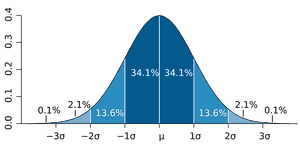
Okay 68% of investors are likely to get decent returns (15.8% ±5.4%). What about the others? About 14% of investors may get luckier than the 68% and get returns ranging from 15.8% + 5.4% to 15.8% +10.8% (10.8% is twice the standard deviation). Another 14% may fare worse than the 68% and get returns ranging from 15.8% – 10.8% to 15.8% – 5.4%. These statements are subject to certain conditions (see below).
No one is likely to loose money (wow! What great comfort!). About 90% of investors are likely to get returns that beat inflation. This is not bad at all. It is important to keep in mind that just because you stay invested in the stock market for long periods of time you are not guaranteed returns that beat inflation. The only thing guaranteed about the market is its volatility!
Ghosts of Scandals Past In FY 1991-92 the Sensex returned an astonishing 267% due to the Harshad Mehta Scam. It corrected the next year by -47% (thanks to Subra for pointing out these facts). Even for the stock market such a large positive return is an aberration. What do you think will the long term CAGR of the market be if the scam did not occur? We can’t turn the clock back and avert the scam but we can certainly see how the long term average will fare if the 267% is replaced by something tamer, say 15% (let us not worry about -47%. Although related to the scam such negative returns are not uncommon!). Why do this? The impact of the scam will provide a natural answer.
The 15 year average CAGR is 15.8%. If I replace the 267% return by 15%, the average CAGR reduces to 10.1% (a 36% decrease!) with a standard deviation of 3.59% (a 34% decrease!). Is this good or bad? The way I see it, if no such scan occurs in future the stock market will be less volatile than it was in the past. Yes returns will be significantly lower but it is more important that volatility is lower. How will you interpret this?
The Excel sheet which has the above mentioned analysis can be downloaded from the link below.
- The annual Sensex returns listed (source: RBI) do not factor in dividends. You can enter a nominal dividend (Subra likes 2%) to see how it will influence the CAGR. Including dividends is Subra’s idea.
- By including a 2% dividend the 15 Y average CAGR increases from 15.8% to 18.1% (the stand deviation increases marginally). How big a change do you think this is?
- Conditions Apply! The above analysis assumes that the Sensex returns follow a Normal Distribution. The normal distribution is God’s own distribution. Any measurement if performed often enough and long enough is expected to follow a normal distribution. Is this true for the Sensex? Quite debatable! I would say it is about 70% true!!
Download the Stock Market Returns Analyzer
- I would love to hear your thoughts on stock market volatility and how you cope with it.
- Important: Did you find this post too mathematical and difficult to understand? If yes, then you have two choices: (a) find something more appealing to read and/or (b) please drop everything and seek help from a financial planner if you haven’t done so. Why?
- Why? Because mathematics rules the world. From the small movement of your index finger which got you to this page to the rotation of our galaxy. That is the way God made it! So read up or ….
🔥Enjoy massive discounts on our courses, robo-advisory tool and exclusive investor circle! 🔥& join our community of 5000+ users!
Use our Robo-advisory Tool for a start-to-finish financial plan! ⇐ More than 1,000 investors and advisors use this!
New Tool! => Track your mutual funds and stock investments with this Google Sheet!
We also publish monthly equity mutual funds, debt and hybrid mutual funds, index funds and ETF screeners and momentum, low-volatility stock screeners.


- Do you have a comment about the above article? Reach out to us on Twitter: @freefincal or @pattufreefincal
- Have a question? Subscribe to our newsletter using the form below.
- Hit 'reply' to any email from us! We do not offer personalized investment advice. We can write a detailed article without mentioning your name if you have a generic question.
Join over 32,000 readers and get free money management solutions delivered to your inbox! Subscribe to get posts via email!
About The Author
 Dr M. Pattabiraman(PhD) is the founder, managing editor and primary author of freefincal. He is an associate professor at the Indian Institute of Technology, Madras. He has over ten years of experience publishing news analysis, research and financial product development. Connect with him via Twitter(X), Linkedin, or YouTube. Pattabiraman has co-authored three print books: (1) You can be rich too with goal-based investing (CNBC TV18) for DIY investors. (2) Gamechanger for young earners. (3) Chinchu Gets a Superpower! for kids. He has also written seven other free e-books on various money management topics. He is a patron and co-founder of “Fee-only India,” an organisation promoting unbiased, commission-free investment advice.
Our flagship course! Learn to manage your portfolio like a pro to achieve your goals regardless of market conditions! ⇐ More than 3,000 investors and advisors are part of our exclusive community! Get clarity on how to plan for your goals and achieve the necessary corpus no matter the market condition is!! Watch the first lecture for free! One-time payment! No recurring fees! Life-long access to videos! Reduce fear, uncertainty and doubt while investing! Learn how to plan for your goals before and after retirement with confidence.
Our new course! Increase your income by getting people to pay for your skills! ⇐ More than 700 salaried employees, entrepreneurs and financial advisors are part of our exclusive community! Learn how to get people to pay for your skills! Whether you are a professional or small business owner who wants more clients via online visibility or a salaried person wanting a side income or passive income, we will show you how to achieve this by showcasing your skills and building a community that trusts and pays you! (watch 1st lecture for free). One-time payment! No recurring fees! Life-long access to videos!
Our new book for kids: “Chinchu Gets a Superpower!” is now available!


Must-read book even for adults! This is something that every parent should teach their kids right from their young age. The importance of money management and decision making based on their wants and needs. Very nicely written in simple terms. - Arun.Buy the book: Chinchu gets a superpower for your child!
How to profit from content writing: Our new ebook is for those interested in getting side income via content writing. It is available at a 50% discount for Rs. 500 only!
Do you want to check if the market is overvalued or undervalued? Use our market valuation tool (it will work with any index!), or get the Tactical Buy/Sell timing tool!
We publish monthly mutual fund screeners and momentum, low-volatility stock screeners.
About freefincal & its content policy. Freefincal is a News Media Organization dedicated to providing original analysis, reports, reviews and insights on mutual funds, stocks, investing, retirement and personal finance developments. We do so without conflict of interest and bias. Follow us on Google News. Freefincal serves more than three million readers a year (5 million page views) with articles based only on factual information and detailed analysis by its authors. All statements made will be verified with credible and knowledgeable sources before publication. Freefincal does not publish paid articles, promotions, PR, satire or opinions without data. All opinions will be inferences backed by verifiable, reproducible evidence/data. Contact information: letters {at} freefincal {dot} com (sponsored posts or paid collaborations will not be entertained)
Connect with us on social media
- Twitter @freefincal
- Subscribe to our YouTube Videos
- Posts feed via Feedburner.
Our publications
You Can Be Rich Too with Goal-Based Investing
 Published by CNBC TV18, this book is meant to help you ask the right questions and seek the correct answers, and since it comes with nine online calculators, you can also create custom solutions for your lifestyle! Get it now.
Gamechanger: Forget Startups, Join Corporate & Still Live the Rich Life You Want
 This book is meant for young earners to get their basics right from day one! It will also help you travel to exotic places at a low cost! Get it or gift it to a young earner.
Your Ultimate Guide to Travel
 This is an in-depth dive into vacation planning, finding cheap flights, budget accommodation, what to do when travelling, and how travelling slowly is better financially and psychologically, with links to the web pages and hand-holding at every step. Get the pdf for Rs 300 (instant download)