Last Updated on August 30, 2021 at 3:25 pm
How would you answer if someone asks you: “I know that a systematic investment plan (SIP) in a mutual fund is an effective way to accomplish financial goals, but how often should I invest? Each month? Each quarter? Or should I invest daily? Which option provides better returns?”

There are two ways of answering this: Without a calculator and with a calculator. Let us consider both.
1. The PERSONAL finance way: I don’t care which option is better. I receive a monthly salary. I take out money for expenses after I invest for my goals. So for me it is convenient if the frequency of investment matches the frequency of cash inflow. If I didn’t have regular monthly income I will probably choose a quarterly SIP.
🔥Secure your future with our Robo-advisory tool trusted by over 3,000 investors and advisors. From effortless retirement planning to funding your children’s biggest dreams, turn your financial goals into reality. 🔥
Subscribe for money management solutions via email! (Link takes you to our email sign-up form) Join 32,000+ readers in our community.
👉 New Tool Alert! NaviPlan: A Privacy-Focused Multi-asset Tracker and Goal Planner 👈
Since I do have regular monthly income I could choose a daily SIP. However I choose not to. I am investing for long term goals in mutual funds with a good track record. Each year there are about 250 trading days. If I do a daily SIP for 5 years, how many entries will my account statement have? This makes monitoring the investment and redemptions pretty cumbersome.
By the same argument investing in a quarterly SIP will give me a much shorter account statement making it easy to monitor and process. However I do not like the idea of my investable income sitting idle for two months. I will have to worry about my bank balance and make sure I don’t spend this money. Getting ‘rid’ of this money as soon as possible is best way to ensure financial peace.
The notion of monthly and quarterly SIP options is understandable. Salaried individuals usually opt for monthly SIP and business men or those who get paid now and then could opt for a quarterly SIP.
Why on Earth is there a bizarre option like a daily SIP open for the retail investor? Beats me. There are circumstances when for the same amount of total investment, investing daily could get me more units and therefore (usually!) more returns than investing each month or each quarter. If a fund is highly volatile (that is its NAV fluctuates up and down wildly), investing daily exposes me to more low NAV days then other options. In such cases a daily SIP could result in higher units and therefore higher returns than a monthly or quarterly SIP. By the same argument a monthly SIP could do better than a quarterly SIP.
The crucial question is will the difference in returns make a significant difference to the corpus I will accumulate. Unless I calculate I won’t know. I don’t care though. I don’t intend to loose sleep over this. I invest in a way best suited for me, period.
To me this question (which is the best? Daily/monthly/quarterly?) is mere hairsplitting.
2. The personal FINANCE way: If the ‘I do what is best suited for me’ argument is not convincing, the only way out is math – the best way to win most arguments (especially hairsplitting ones). Here is a calculator that can compare returns from daily, monthly and quarterly SIPs using NAV history of any mutual fund. You can compare results for any investment period for which NAV data is available.
Three versions of the calculator are available:
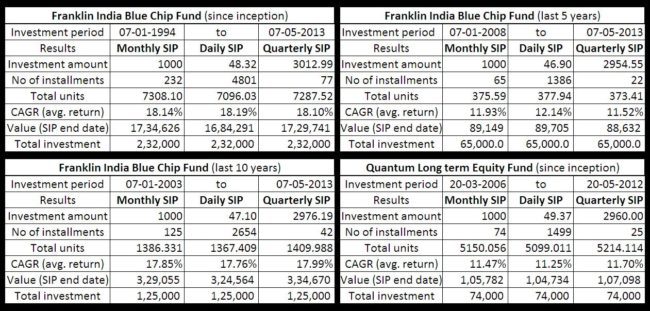
- One with NAV history of Franklin India Blue Chip fund from Jan. (7th) 1994 to Jun. (4th) 2013. A fund with a consistent terrific record.
- One with NAV history of Quantum Long Term Equity from Mar. (20th) 2006 to Jun. (6th) 2013. A fund which has performed remarkably well in a choppy market.
- One with no NAV entries. You can enter NAV history of any mutual fund to
1. compare daily, monthly and quarterly SIP returns
2. calculate returns of your ongoing SIPs
NAV history from fund inception will have to be obtained from the AMC’s website. NAV history from Jan. 2000 for all mutual funds in excel format can be obtained here: Personalfn Nav History
The blank sheet can be modified by someone interested in different ways:
- you could generate a SIP account by using some clever Excel features
- you could integrate this with the Excel MF tracker to integrate past and future SIP records
- NAV history allows you to do a whole lot of analysis on MF risk and return (coming soon!)
Results: Here are few snapshots from the calculator. Please draw your own conclusions. Use the calculator for further analysis. As far as I am concerned: I receive my salary each month and therefore invest each month, period.
Download Monthly vs. Daily vs. Quarterly SIP Calculators (Franklin India Blue Chip)
Download Monthly vs. Daily vs. Quarterly SIP Calculators (Quantum Long Term Equity)
Download Monthly vs. Daily vs. Quarterly SIP Calculators (enter NAV history of any mutual fund)
Credits: Prasnath wanted to know if I had compared daily vs. monthly SIP returns. Though I am not interested in the answer the only reason I made this calculator is because of the challenge involved in ensuring the transaction dates for monthly and quarterly SIPs are taken into account correctly. Thanks to Prasanth’s question I had a good time figuring out how to do this in Excel.
Source:
Franklin India Blue Chip NAV history
Quantum Long Term Equity NAV History
Related articles
- Excel-based Mutual Fund Portfolio Tracker (Version 1)
- Mutual Fund SIP Returns Calculator

Join 32,000+ readers and get free money management solutions delivered to your inbox! Subscribe to get posts via email! (Link takes you to our email sign-up form)
🔥You can also avail massive discounts on our courses and the freefincal investor circle! 🔥& join our community of 8000+ users!
Track your mutual funds and stock investments with this Google Sheet!
We also publish monthly equity mutual funds, debt and hybrid mutual funds, index funds, and ETF screeners, as well as momentum and low-volatility stock screeners.
You can follow our articles on Google News

We have over 1,000 videos on YouTube!

Join our WhatsApp Channel


- Do you have a comment about the above article? Reach out to us on Twitter: @freefincal or @pattufreefincal
- Have a question? Subscribe to our newsletter using the form below.
- Hit 'reply' to any email from us! We do not offer personalised investment advice. We can write a detailed article without mentioning your name if you have a generic question.
Join 32,000+ readers and get free money management solutions delivered to your inbox! Subscribe to get posts via email! (Link takes you to our email sign-up form)
About The Author
Dr M. Pattabiraman (PhD) is the founder, managing editor and primary author of freefincal. He is an associate professor at the Indian Institute of Technology, Madras. He has over 14 years of experience publishing news analysis, research and financial product development. Connect with him via Twitter(X), LinkedIn, or YouTube. Pattabiraman has co-authored three print books: (1) You can be rich too with goal-based investing (CNBC TV18) for DIY investors. (2) Gamechanger for young earners. (3) Chinchu Gets a Superpower! for kids. He has also written seven other free e-books on various money management topics. He is a patron and co-founder of “Fee-only India,” an organisation promoting unbiased, commission-free, AUM-independent investment advice.
Our flagship course! Learn to manage your portfolio like a pro to achieve your goals regardless of market conditions! ⇐ More than 3,500 investors and advisors are part of our exclusive community! Get clarity on how to plan for your goals and achieve the necessary corpus no matter the market condition!! Watch the first lecture for free! One-time payment! No recurring fees! Life-long access to videos! Reduce fear, uncertainty and doubt while investing! Learn how to plan for your goals before and after retirement with confidence.
Increase your income by getting people to pay for your skills! ⇐ More than 800 salaried employees, entrepreneurs and financial advisors are part of our exclusive community! Learn how to get people to pay for your skills! Whether you are a professional or small business owner seeking more clients through online visibility, or a salaried individual looking for a side income or passive income, we will show you how to achieve this by showcasing your skills and building a community that trusts and pays you. (watch 1st lecture for free). One-time payment! No recurring fees! Life-long access to videos!
Our book for kids: “Chinchu Gets a Superpower!” is now available!


Must-read book even for adults! This is something that every parent should teach their kids right from their young age. The importance of money management and decision making based on their wants and needs. Very nicely written in simple terms. - Arun.Buy the book: Chinchu gets a superpower for your child!
How to profit from content writing: Our new ebook is for those interested in getting a side income via content writing. It is available at a 50% discount for Rs. 500 only!
Do you want to check if the market is overvalued or undervalued? Use our market valuation tool (it will work with any index!), or get the Tactical Buy/Sell timing tool!
We publish monthly mutual fund screeners and momentum, low-volatility stock screeners.
About freefincal & its content policy. Freefincal is a News Media organisation dedicated to providing original analysis, reports, reviews and insights on mutual funds, stocks, investing, retirement and personal finance developments. We do so without conflict of interest and bias. Follow us on Google News. Freefincal serves more than three million readers a year (5 million page views) with articles based only on factual information and detailed analysis by its authors. All statements made will be verified with credible and knowledgeable sources before publication. Freefincal does not publish paid articles, promotions, PR, satire or opinions without data. All opinions will be inferences backed by verifiable, reproducible evidence/data. Contact Information: To get in touch, please use our contact form. (Sponsored posts or paid collaborations will not be entertained.)
Connect with us on social media
- Twitter @freefincal
- Subscribe to our YouTube Videos
- Posts feed via Feedburner.
Our publications
You Can Be Rich Too with Goal-Based Investing
 Published by CNBC TV18, this book is designed to help you ask the right questions and find the correct answers. Additionally, it comes with nine online calculators, allowing you to create custom solutions tailored to your lifestyle. Get it now.
Gamechanger: Forget Startups, Join Corporate & Still Live the Rich Life You Want
 This book is designed for young earners to get their basics right from the start! It will also help you travel to exotic places at a low cost! Get it or gift it to a young earner.
Your Ultimate Guide to Travel
 This is an in-depth exploration of vacation planning, including finding affordable flights, budget accommodations, and practical travel tips. It also examines the benefits of travelling slowly, both financially and psychologically, with links to relevant web pages and guidance at every step. Get the PDF for Rs 300 (instant download)