Here is a list and navigational guide to all the stock analysis tools and calculators available at freefincal.
I Stock Screener
The following screens are available
- Piotroski Score
- Altman-Z Score
- Modified C-Score
- Debt to Equity
- PEG
- Enterprise Multiple EV/EBITDA –
- Current PE less than Median PE
- Current PE more than Median PE
Read more: Freefincal Excel Stock Screener
II Automated Stock Analyzer
Analyze stocks automatically and value them in multiple ways!
The automated stock analysis sheet
🔥Secure your future with our Robo-advisory tool trusted by over 3,500 investors and advisors. From effortless retirement planning to funding your children’s biggest dreams, turn your financial goals into reality. 🔥
Subscribe for money management solutions via email! (Link takes you to our email sign-up form) Join 32,000+ readers in our community.
👉 New Tool Alert! NaviPlan: A Privacy-Focused Multi-asset Tracker and Goal Planner 👈
- pulls financials from morningstar and analyzes them
- pulls adjusted stock price history from money control, and
- calculates intrinsic value six different ways!
It also pulls annual (standalone/consolidated) and quarterly financials from Value Research online.
Valuation models available:
1) Price Multiple Model
2) Sustainable Growth Rate
3) Book Value Growth Rate (Buffett’s approach to valuation)
4) Discounted Cash FlowOpens in a new window (DCF)
6) Graham formula and Graham number
7) Piotroski Score for the last 9 financial years
8) Earnings Growth Estimate
9) Automated Return on Equity Analysis with the Dupont Formula
10) Altman Z-score analysis of the financial health of a business
Latest Version: Automated Stock Analysis with Screener.in data
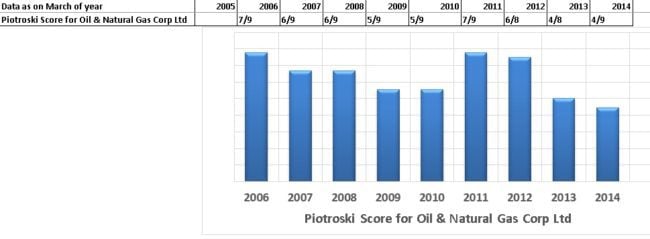
III Nifty Valuation Analyzer
Use this Excel sheet to automatically determine Nifty valuations with long-term averages of PE, PB and Div Yield ratios along with ROE and rolling one-year EPS growth rate and dual moving averages.
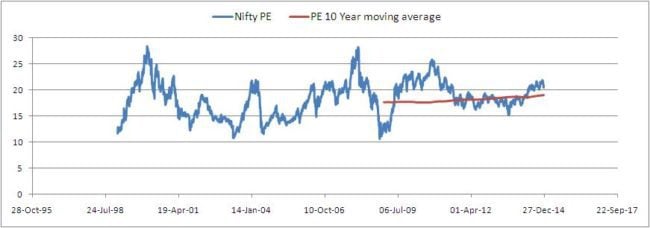
Read more: Nifty Valuation Analyzer: PE, PE, Div Yield, ROE, EPS Growth
IV Stock SIP Calculator
Here is a Stock SIP Calculator for Indian stocks. It can be used to determine returns (XIRR) and monthly variation in returns since January 2000.
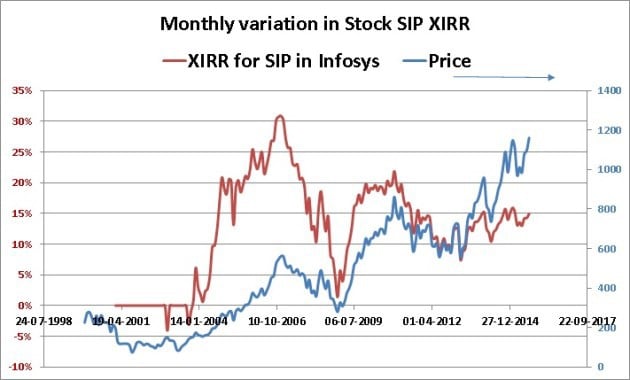
Read more: Stock SIP Calculator
V Compare Stock A vs Stock B
Use this Excel tool to compare risk vs. reward in Indian stock investments.
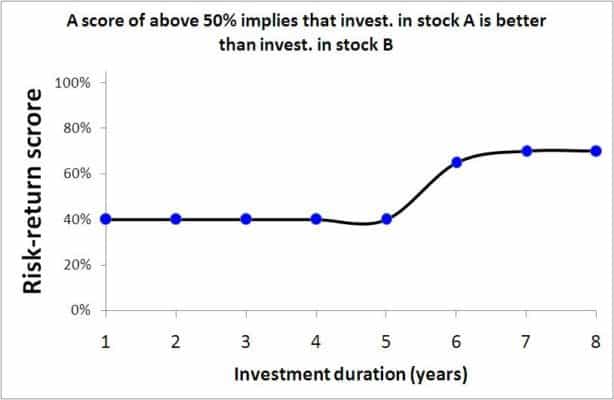
Read more: Stock Comparison Tool: Risk vs. Reward
VI Stock Market Hurricane Warning Indicator!
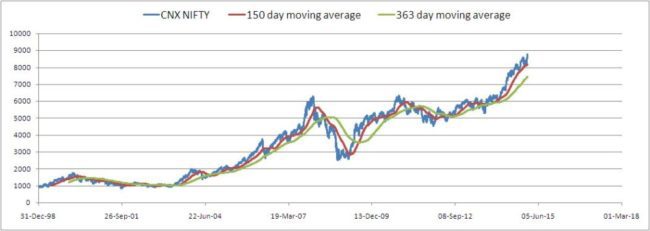
Use this moving average calculator to get an approximate quantitative estimate of current market levels. It calculates two moving averages (over durations that can be varied by the user) of 30+ BSE and NSE market indices.
My aim in making this tool is to get an idea of long-term market trendsfollowing the method described by Jim Otar in his ‘Hurricane Warning Chart’
Read more: Moving Average Market Level Indicator
Do explore these tools and let me know your feedback.