Last Updated on March 21, 2017 at 12:51 pm
Here is a Stock SIP Calculator for Indian stocks. It can be used to determine returns (XIRR) and monthly variation in returns since January 2000.
‘Can one do a SIP in stocks?” is a question many youngsters often ask. The reason they ask is obvious. The amount of capital at their disposal is small and they can only buy a few stocks of a company each month.
The answer is tricky. I am no expert in stock picking and do not hold any stocks in my portfolio. I however recognise that, a SIP in stocks is quite different from a SIP in mutual funds.
A Stock corresponds to an actively managed business. A mutual fund represents an actively managed portfolio that invests in tradable securities. Any fund house which cares about public perception and their own survival will keep an eye on how fund management teams perform and ring in timely changes. The fortunes of many mutual funds have changed because of such changes.
🔥Secure your future with our Robo-advisory tool trusted by over 3,500 investors and advisors. From effortless retirement planning to funding your children’s biggest dreams, turn your financial goals into reality. 🔥
Subscribe for money management solutions via email! (Link takes you to our email sign-up form) Join 32,000+ readers in our community.
👉 New Tool Alert! NaviPlan: A Privacy-Focused Multi-asset Tracker and Goal Planner 👈
Therefore, I strongly believe and advocate that aside from having a basic strategy, fund selection is not as important as it is made out to be. Read more: How important is mutual fund selection?
A monthly SIP with a basic periodic (yearly) review is all that any retail investor requires to “build wealth” and beat inflation.
A business is a different ball game. Businesses die all the time. This can due to a variety of reasons: the wheels of time which discards technologies and practices, inefficient management, fraud to name just a few. A business can pick and choose where it can invest and what it can do, like a mutual fund.
A stock SIP requires an ability to thoroughly understand the nature of a business and then evaluate the nature of the balance sheet. A futuristic view of how a company would fare in future (its past history of adaptability is a good signal) is crucial.
It is easy for me to source historical stock prices from Moneycontrol (adjusted for bonuses and splits, but excluding dividends), calculate the XIRR of a monthly SIP from Jan 2000 and how the XIRR varies month by month. This is similar to the Mutual Fund SIP XIRR Tracker Version 2.0.
It is easy for me (and you) to pick a Colgate or HDFC bank today, calculate the XIRR for a monthly SIP from Jan 2000 (one share purchased with closing price on the first of each month), and claim that a stock SIP works!
However, would I have known in 2000 that HDFC or a Colgate would have worked? Well, not me for sure. I am not R. Balakrishnan – Video: R. Balakrishnan on “investing for keeps: in equities I trust”
Here is a three stock SIP idea he suggested: Backtesting a three stock portfolio: L&T, ITC, Axis Bank
Bottomline, using this calculator to claim that a Stock SIP calculator works is hindsight bias. To claim that it may not work for all companies is also hindsight bias, but I do not mind that kind of bias.
Past performance is no guarantee of future results. However,
Past risk is a guarantee of minimum* future risk.
(*) risk observed in the past is the baseline risk one can expect in future. The future can be more or less risky.
Backtesting is to brace ourselves for the future and not be overconfident about it.
Therefore, a stock SIP will work only if
- one understands the business and knows how to interpret balance sheets
- one carries a thorough periodic review
- the review is positive, must patiently keep investing for years to get ‘good’ returns.
- the review is negative, one must ruthlessly chuck the stock and search for another.
Use the tool with caution.
The stock price download module is identical to the Stock Analyzer 7: Graham Formula and Graham Number
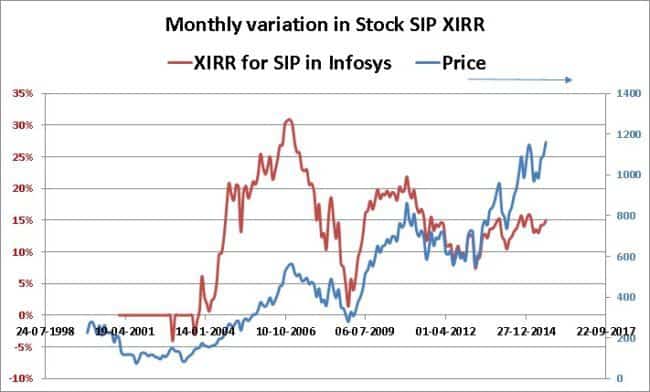
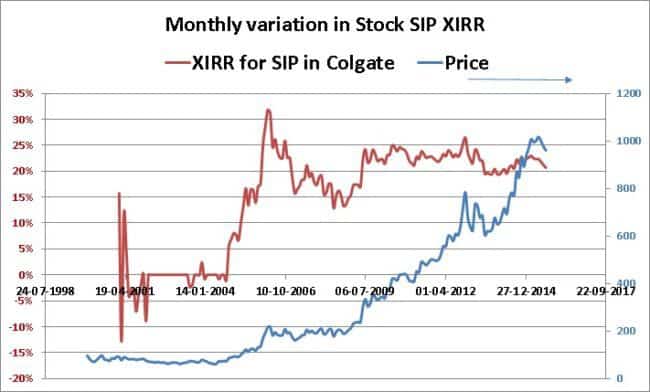
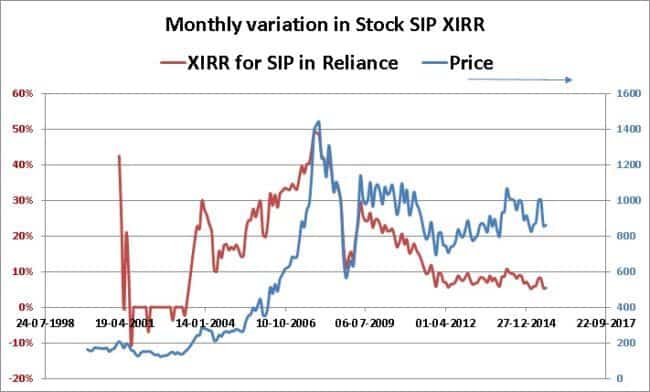
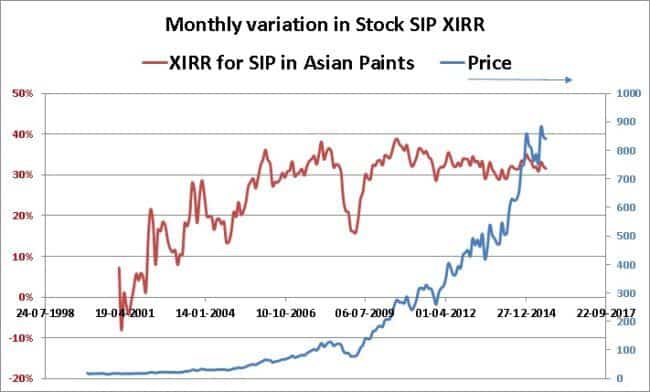
Here are few screenshots. The blue line is the price variation (right axis) and the burgundy line is the month-by-month variation in XIRR.
Download the Stock SIP Calculator
Thanks to Leo for pointing this out.