Last Updated on February 12, 2022 at 6:14 pm
Every mutual fund sales guy says, “the best way to build wealth is via SIP in an equity mutual fund over the long term”. However, where is the proof that a long-term equity mutual fund SIP would work? In this article, we analyse 40+ years of the Sensex and 106 years of the S&P 500 to check if there is any truth to this claim.
To claim whether a long-term SIP in stocks ‘works’ or not, we shall first have to define ‘long-term’ and the benchmark for the performance. We shall define ‘long-term’ as ten years and 15 years (two durations), and we shall have a successful long-term equity SIP as one that provides a return well above the consumer price inflation (CPI). All data sources used in this study are linked below.
S&P 500 TRI vs Inflation (both in USD)
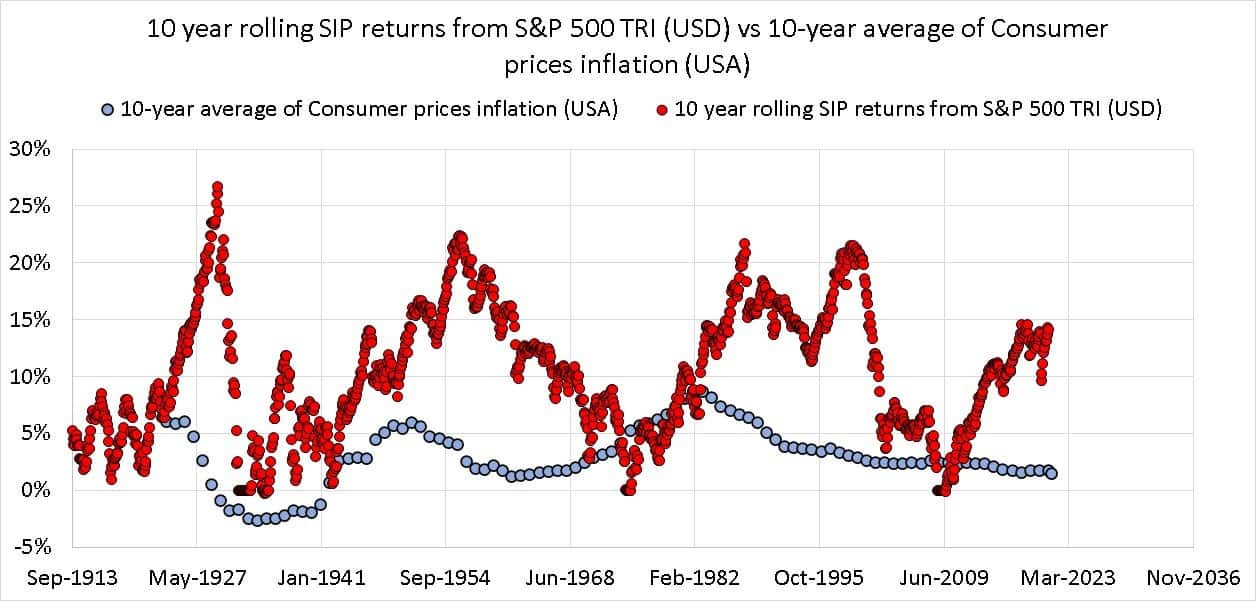
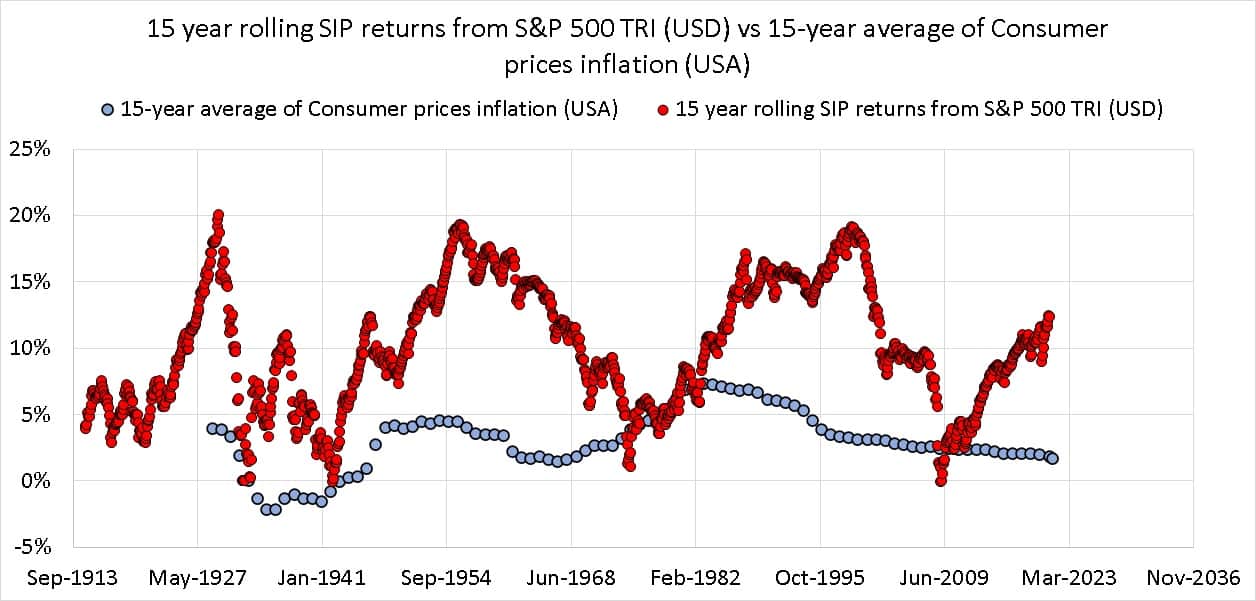
The 10-year and 15-year rolling SIP returns for S&P 500 TRI and the corresponding 10-year and 15-year CPI average are shown below. All in USD (forex is not relevant here as we are considering a US resident)
🔥Secure your future with our Robo-advisory tool trusted by over 3,500 investors and advisors. From effortless retirement planning to funding your children’s biggest dreams, turn your financial goals into reality. 🔥
Subscribe for money management solutions via email! (Link takes you to our email sign-up form) Join 32,000+ readers in our community.
👉 New Tool Alert! NaviPlan: A Privacy-Focused Multi-asset Tracker and Goal Planner 👈
15-year rolling SIP returns from S&P 500 TRI (USD) vs a 15-year average of Consumer prices inflation (USA)Even if the annual US inflation is about 5%, the SIP has done reasonably well. It has not been able to beat inflation every time, but that is perfectly understandable. Notice how much returns have fluctuated and their cyclic behaviour. Returns over 10 and 15 years have even been 0%!
Sensex vs PPF vs CPI (all in INR)
We have Sensex price data from 1979 but TRI data only from 1999. Therefore, we use the price returns and add a (generous) 2% contribution to the returns from dividends. The PPF returns, and the 15-year average of the CPI inflation is also shown.
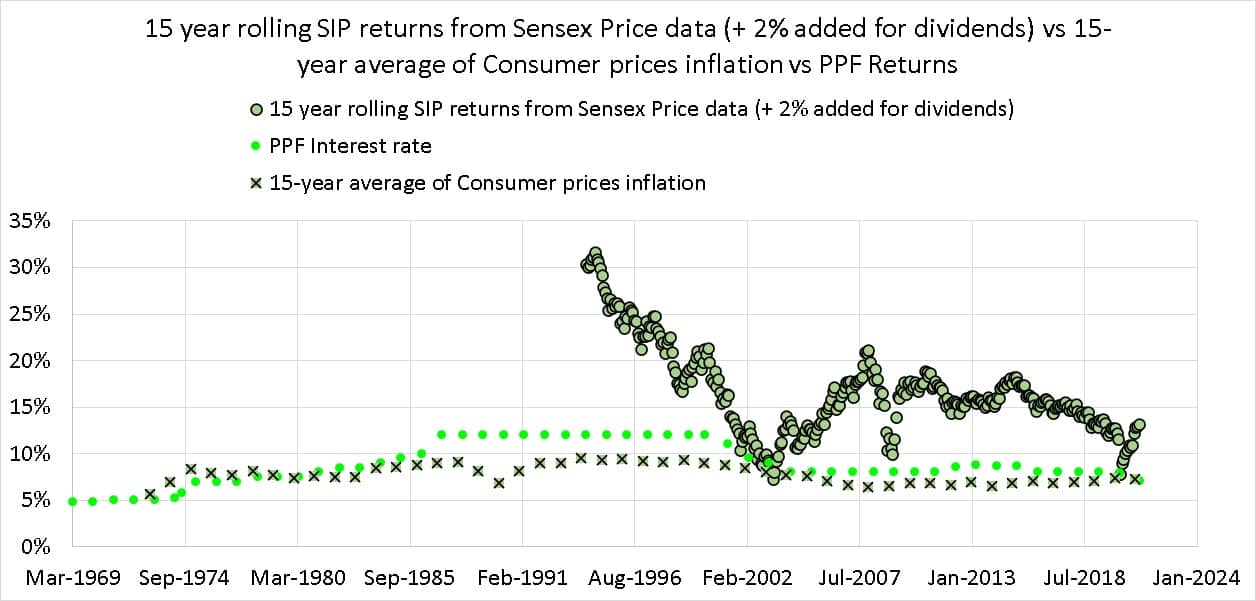
Notice that the PPF rate has often been higher than the long-term CPI average, particularly in the 90s when the Indian govt was on the brink of bankruptcy. If we compare our personal inflation rate, it would be close to the PPF rate than the CPI!
The 15Y SIP has comfortably beat the CPI and the PPF, again not always, but this is quite acceptable. Notice the cyclic nature is not fully manifest due to the short history. Even the range of returns possible is quite extensive.
‘Asset class win’ vs ‘investor win’
The reader should appreciate the difference between an investment in an asset class succeeding and an investor succeeding. We are not referring to behavioural issues.
Suppose the 10-year average CPI is, say, 3% (prices in USD). If the return from a 10-year SIP in S& P 500 (aka dollar-cost averaging) is 4% (in USD, before tax), the asset has ‘won’. That is, the asset class got a positive real return.
(1+ Real return of the asset class) = (1+asset class return)/(1+inflation)
The question is, did the investor who has got this 4% return over ten years also win?
We will have to pull out the “it depends” card for this. There are several considerations.
- How much return did the investor expect? If they wanted more than 4%, they would have invested less <= disappointment.
- Even if they are happy with 4%, taxes will reduce the “real returns” to 0% or negative <= disappointment.
(1+ Real return of the investor for an asset class) = (1+post-tax asset class return)/(1+inflation)
- Unfortunately, there is no. No one is going to invest only in equity. So the asset allocation matters. An investor who is going expecting more return from an asset class will tend to hold more of that in the portfolio. Meaning if the actual return is lower (before or after-tax), the disappointment will be higher.
This is the reason why an asset class succeeding is not the same as an investor succeeding. A sales guy will never tell you this. They will only highlight the “behaviour gap” – the difference between what the equity market gives and what the investor gets because of not investing systematically, panic selling etc.
What we saw above, can be called the “expectation gap” – what we expected and planned for and what we got despite regular investing. If can reduce the expectation gap from day one, we can simultaneously reduce the behaviour gap. Why? The best way to reduce panic and emotional decisions is to have a solid plan in place.
A sales guy cannot sell without the promise of “high returns”. If we buy without proper planning and appreciating risks, an expectation gap will trigger further bad decisions.
First plan, then worry about emotions!
The key takeaway is, while equity is the right asset class to fight inflation, there no guarantees of success. If you blindly invest each month, then you are leaving the fate of your investments to luck. Undoubtedly, your money deserves better treatment, even if you don’t!
The spread of possible returns is too much to expect something comfortable and live in hope. Systematically investing is not enough; systematically managing risk in a goal-based manner is essential.
Conclusions
When we set out to ask, “does long-term equity-SIP investing work?‘ we have a two-step process to cover. Does the asset class beat inflation more often than not over ten years or 15 years? The answer is ‘yes’. This makes equity the right choice for dollar-cost averaging or SIP investing (this means investing at some comfortable interval and not monthly).
However, we saw that 10Y or 15Y years of systematic investing does not lead to some nice and comfortable return. The returns can swing wildly, and where we have a long enough market history, the returns are wavey/cyclic (up followed by downs). This means if the investor makes the mistake of expecting a high return and/or has high exposure in the portfolio, then long-term equity SIP investing will not work!
So the choice of the asset class (equity) is correct, but choosing the right asset allocation that can handle sequences of returns risk remains. If this is not done correctly, an inflation-beating return could still turn out to be a disappointment.
Data Sources
- S& P 500 TRI Data from 1900 (the inflation adjustment was removed for this study)
- US CPI data
- India CPI data
- PPF interest rate history