In this edition of the fund performance report, we review DSP Equity & Bond Fund. The fund was launched as DSP Merrill Lynch Balanced Fund in May 1999. Then, DSP BlackRock Balanced Fund in 2008, and DSP Equity and Bond Fund in 2018. The fund currently has an AUM of Rs. 6,837 Crores.
Disclaimer: Fund performance reports present return and risk analysis of a fund with representative benchmarks and not investment recommendations. It must be expressly understood that the data below reflect only past performance and is in no way an indication of future performance. Our investment recommendations can be found here: Handpicked List of Mutual Funds (PlumbLine).
We find out how consistently the Fund has performed wrt Nifty 100 TRI and CRISL 65:35 Aggressive hybrid index. We will use three metrics to analyze performance consistency versus benchmarks. Analysis such as this can be found for 350+ equity funds in our monthly mutual fund screener.
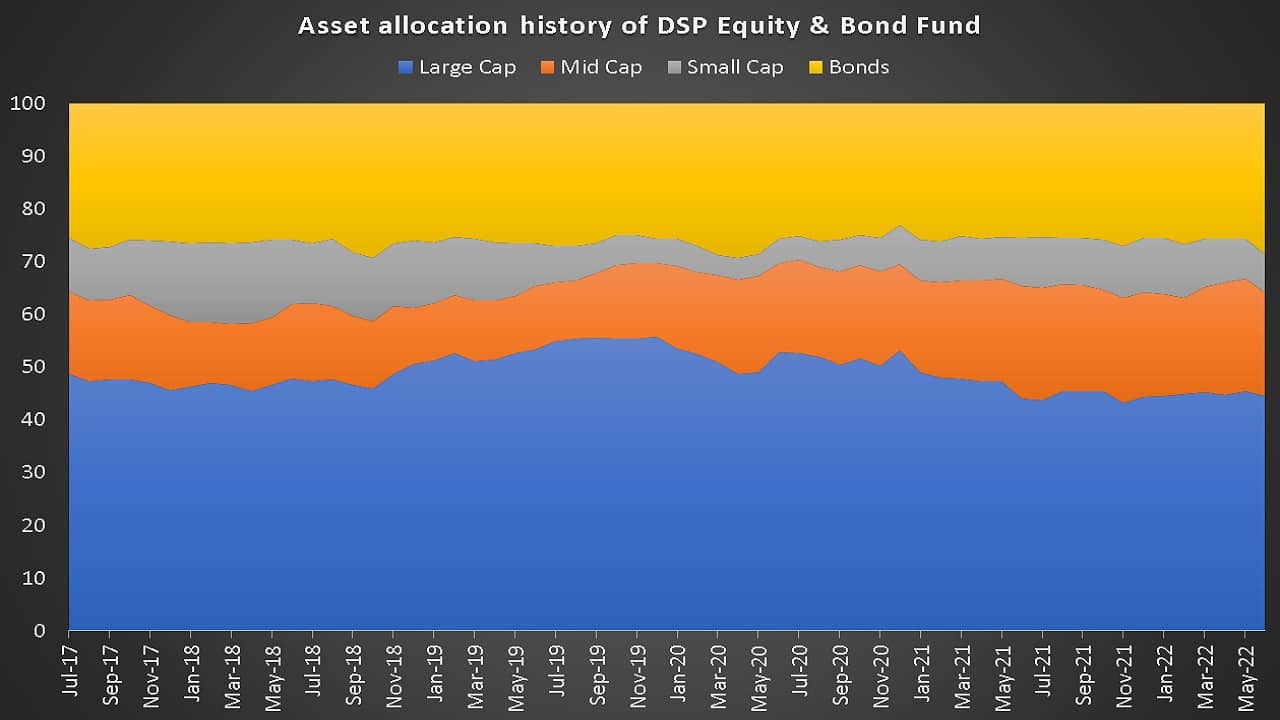
The asset allocation history of the DSP Equity & Bond Fund is shown below. The equity portion has behaved like a large and mid cap fund with a small exposure to small cap stocks. This allocation is fairly constant over time.
1 Rolling return outperformance consistency: the fund returns are compared with category benchmark returns over every possible 3Y,4Y, and 5Y period. Higher the outperformance consistency, the better. Suppose 876 fund returns were compared with 876 benchmark returns, and the fund has beaten the benchmark 675 times. The consistency score will be 675/876 ~ 77%.
🔥Secure your future with our Robo-advisory tool trusted by over 3,500 investors and advisors. From effortless retirement planning to funding your children’s biggest dreams, turn your financial goals into reality. 🔥
Subscribe for money management solutions via email! (Link takes you to our email sign-up form) Join 32,000+ readers in our community.
👉 New Tool Alert! NaviPlan: A Privacy-Focused Multi-asset Tracker and Goal Planner 👈
Three years
| Metric | Nifty 100 TRI | Crisil6535 |
| No of rolling return entries Index (3 Years) | 1621 | 1624 |
| No of rolling return entries Fund (3 years) | 1621 | 1624 |
| No of times fund outperformed index (3 years) | 1098 | 1209 |
| rolling return outperformance Consistency Score (3 years) | 68% | 74% |
Four years
| Metric | Nifty 100 TRI | Crisil6535 |
| No of rolling return entries Index (4 Years) | 1377 | 1380 |
| No of rolling return entries Fund (4 years) | 1377 | 1380 |
| No of times fund outperformed index (4 years) | 813 | 1135 |
| rolling return outperformance Consistency Score (4 years) | 59% | 82% |
Five years
| Metric | Nifty 100 TRI | Crisil6535 |
| No of rolling return entries Index (5 Years) | 1129 | 1130 |
| No of rolling return entries Fund (5 years) | 1129 | 1130 |
| No of times fund outperformed index (5 years) | 749 | 1016 |
| rolling return outperformance Consistency Score (5 years) | 66% | 90% |
That is a reasonably consistent above-average performance.
2 Upside performance consistency over every possible 1Y,2Y,3Y,4Y, 5Y: Higher the better. A score of 70% means, 7 out of 10 times, the Fund performed better than the category benchmark when the benchmark was moving up. This is a measure of reward. It is computed from rolling upside capture data (see link below).
| Metric | Nifty 100 TRI | Crisil6535 |
| upside performance consistency (3 years) | 5% | 98% |
| upside performance consistency (4 years) | 0% | 100% |
| upside performance consistency (5 years) | 0% | 100% |
DSP Equity & Bond Fund tends to outperform the hybrid index when the index is on the upmove.
| Metric | Nifty 100 TRI | Crisil6535 |
| downside protection consistency (3 years) | 100% | 19% |
| downside protection consistency (4 years) | 100% | 16% |
| downside protection consistency (5 years) | 100% | 2% |
The downside protection consistency wrt Nifty 100 TRI can be discounted as the index does not hold bonds like the fund. The fund typically does not protect the downside. That is, when the hybrid index fell, it fell more.
Most funds outperform the index with good downside capture. DSP Equity & Bond Fund is of the few funds to accomplish outperformance with good upside capture.
Trailing Returns
| Benchmark | Nifty 100 TRI | Crisil6535 |
| Trailing Benchmark Return 1Y | 8.390% | 6.846% |
| Trailing Fund Return 1Y | 0.591% | 0.591% |
| Trailing Benchmark Return 2Y | 26.840% | 19.672% |
| Trailing Fund Return 2Y | 21.270% | 21.270% |
| Trailing Benchmark Return 3Y | 18.546% | 15.905% |
| Trailing Fund Return 3Y | 16.578% | 16.578% |
| Trailing Benchmark Return 4Y | 12.221% | 11.889% |
| Trailing Fund Return 4Y | 12.099% | 12.099% |
| Trailing Benchmark Return 5Y | 12.448% | 11.238% |
| Trailing Fund Return 5Y | 11.135% | 11.135% |
The fund’s last year has been quite poor, but it has fared better over longer (trailing) durations.
DSP Equity & Bond Fund has a reasonable but unspectacular performance consistency record. The trailing 1Y performance is worrying and prevents us from recommending the fund to new investors. Existing investors will have to take a call by reviewing their personal performance records (this will vary considerably depending on when they started investing). See, for example, The Blind Men and the Mutual Fund! Standard past performance disclaimers, as noted above, apply. Kindly do your own research before investing or exiting.