Last Updated on April 27, 2025 at 9:21 am
We there is a discussion on gold returns, someone tends to point that “silver has done better” or “silver has more upside potential than gold” or some such statement. In this article, we compare returns and risk associated with gold and silver from Jan 1979 to Aug 2020.
As of now, for the typical retail investor, this comparison is only academic as there is no Indian silver ETF or fund or fund with an underlying silver ETF. An attempt to launch them in 2010-11 did not bear fruition. However, in May 2019 SEBI allowed mutual funds to participate in exchange-traded commodity derivatives including silver.
Via this rule, multi-asset funds can get commodity exposure up to 30%. See our earlier report: Will ICICI Multi-Asset Fund become more volatile with Commodity Derivatives?
🔥Secure your future with our Robo-advisory tool trusted by over 3,500 investors and advisors. From effortless retirement planning to funding your children’s biggest dreams, turn your financial goals into reality. 🔥
Subscribe for money management solutions via email! (Link takes you to our email sign-up form) Join 32,000+ readers in our community.
👉 New Tool Alert! NaviPlan: A Privacy-Focused Multi-asset Tracker and Goal Planner 👈
In this article, we shall only focus on the returns and risk associated with a silver investment compared to that in gold. As we shall see below, silver price volatility is almost twice that of gold as the demand and supply forces are quite different. Those who wish to learn more about these differences can consult this article on the Gold/Silver price ratio.
We are comparing gold and silver only from the point of view of their price movements (and resulting gains or losses). The traditional, emotional, psychological values associated with these metals and the resulting purchase for aesthetic use as jewellery, ornamentation etc is not (cannot be) factored in.
A key difference is the nature of the demand. Silver as many readers may be aware has higher demand in industry and may not perform well during a recession, unlike gold. When investors see a long-term price chart of gold, they concluded – hastily and therefore inaccurately – that “gold prices always keep moving up”.
We have dispelled this myth multiple times before. See for example Gold: 11% annualized return in 41 years, but there is a catch. When we see a long-term price chart of silver, it is tempting to once again hastily conclude that “silver is a bad investment”.
Gold vs Silver Price Movement in INR and USD
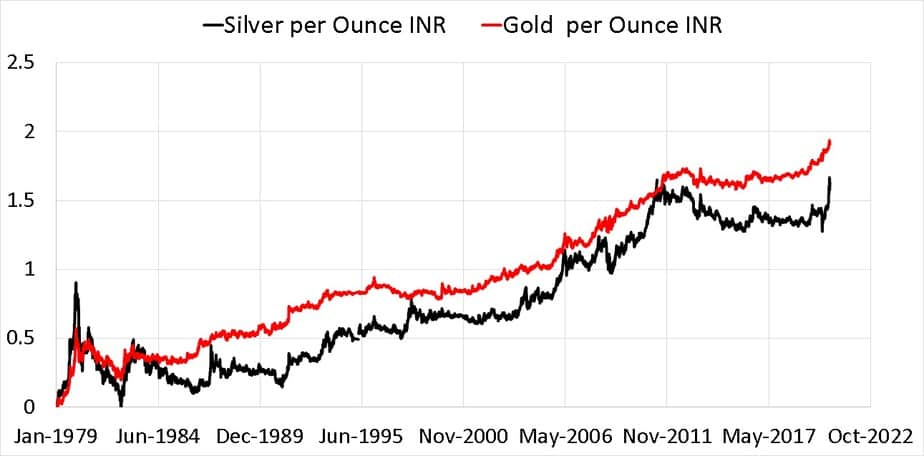
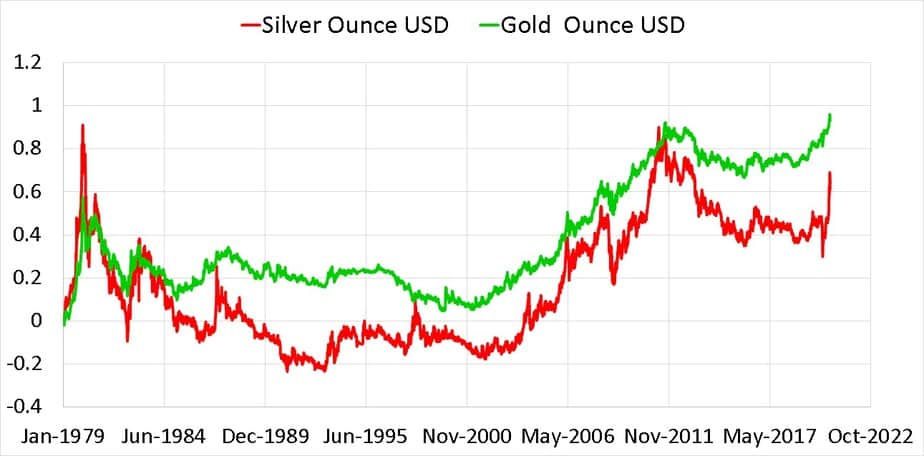
In both graphs above, the price scale in log10 scale. Each 0.5 division represents a movement of the same magnitude. The higher volatility of silver is seen better in USD. We need to look at rolling returns to appreciate risk and reward in a silver investment.
Gold vs Silver Rolling Returns and Rolling Risk Comparison
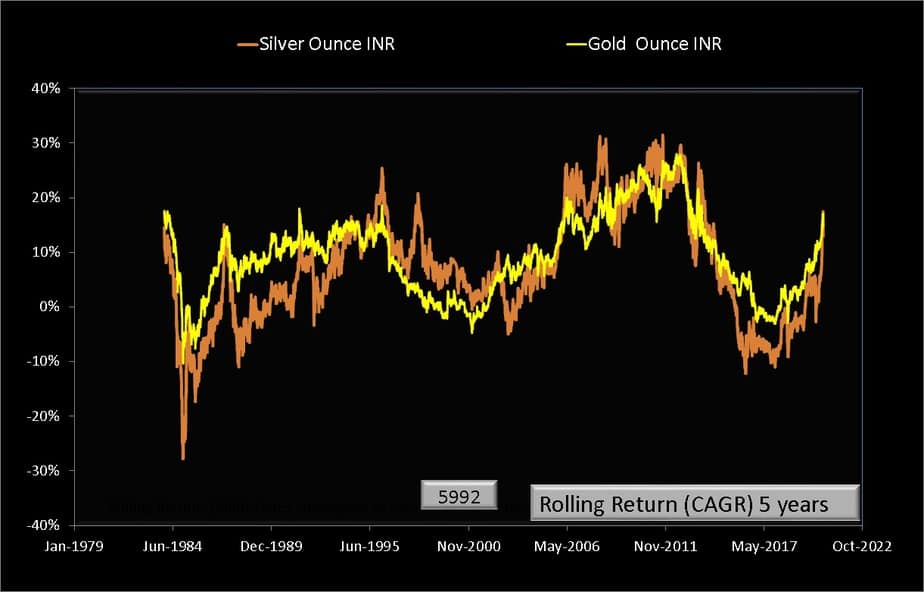
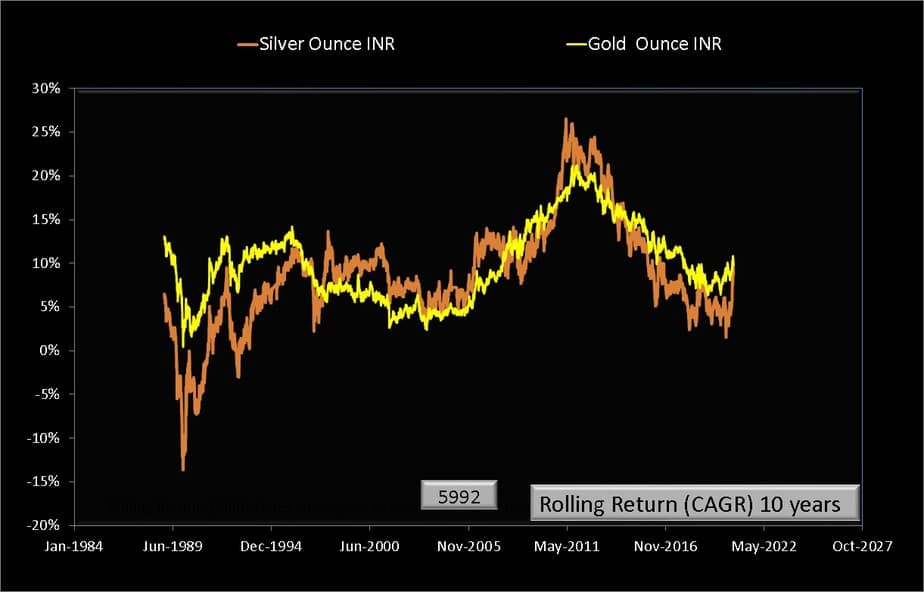
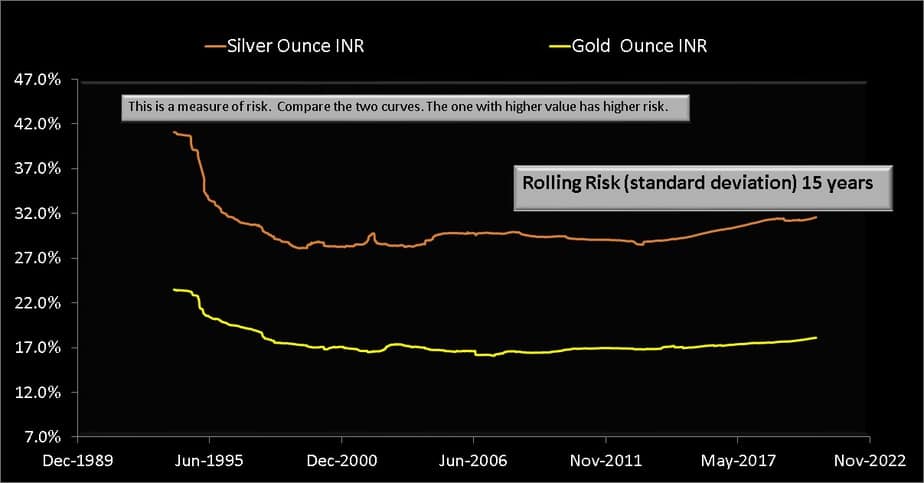
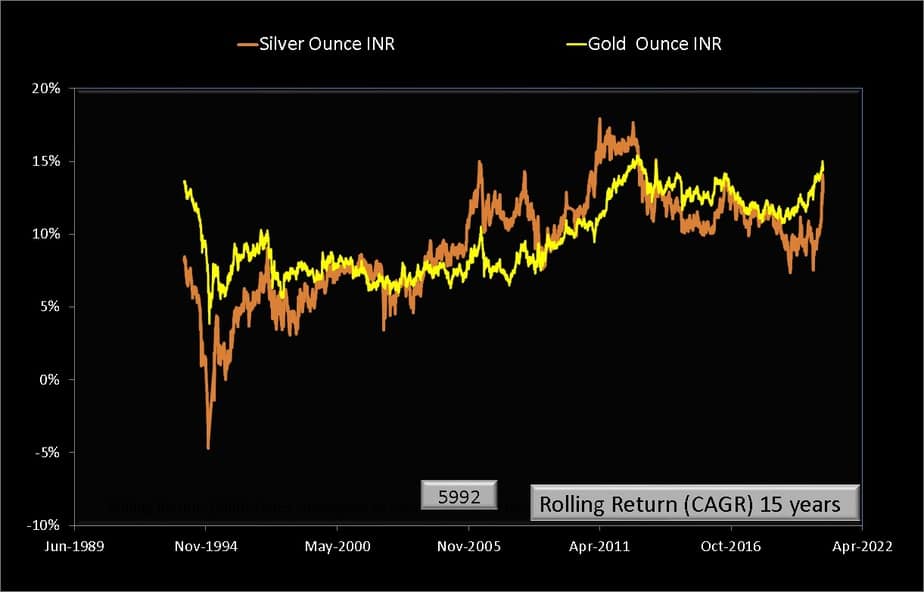
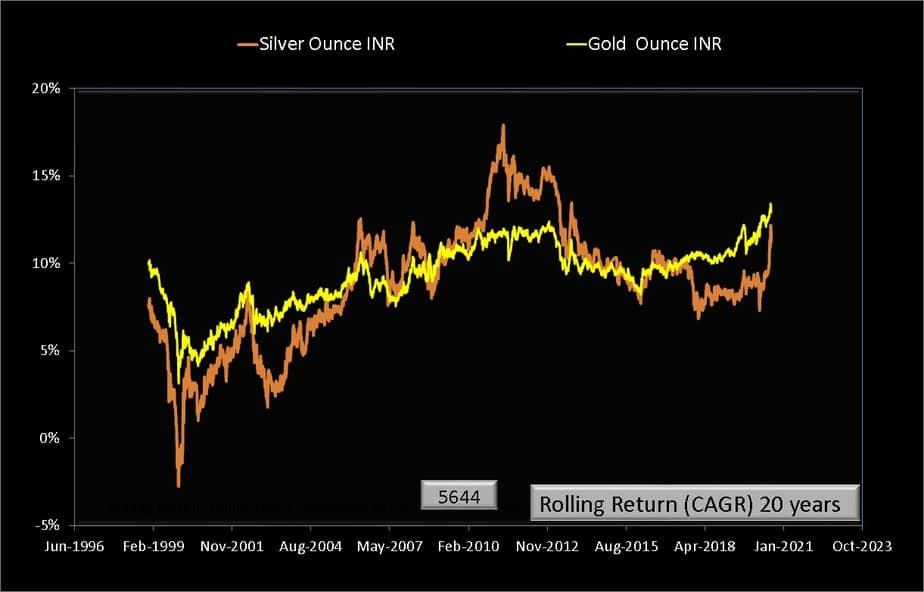
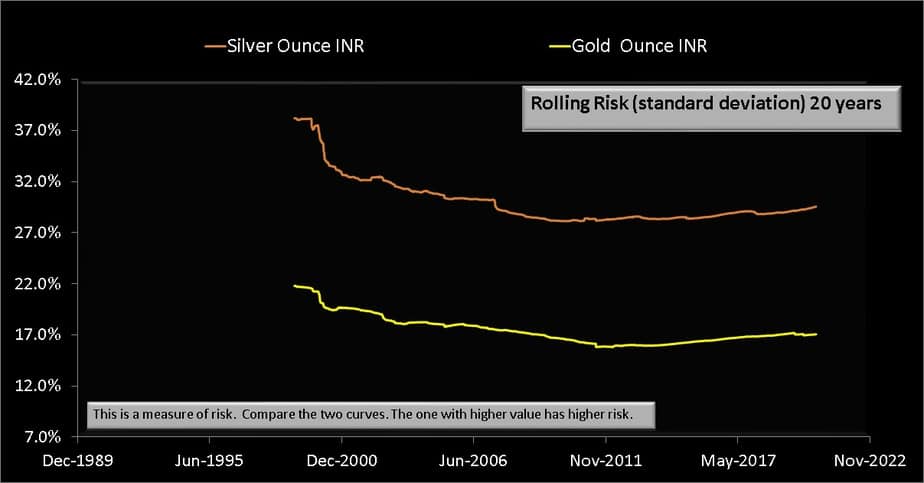
In the charts below, we consider every possible 5,10, 15 and 20-year returns from gold and silver price movements. We also consider rolling standard deviation or (price risk aka volatility) from Jan 1979 to Aug 2020.
Five years
Returns
Risk
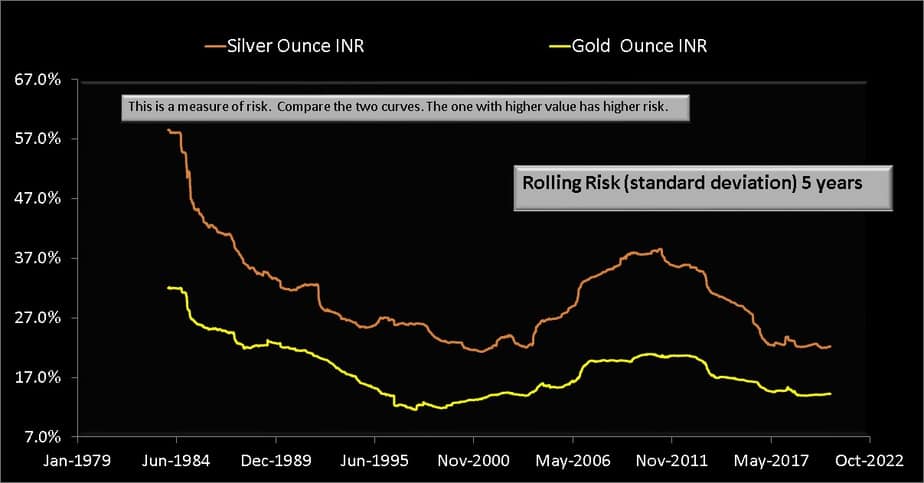
Notice the spread in returns (min return to max return). This is a measure of risk and is obviously higher for silver. The rolling standard deviation – a measure of daily price ups and down also confirms this. Silver volatility is almost regularly twice as that of gold!
Ten Years
Returns
Risk
Fifteen Years
Returns
Risk
Twenty Years
Returns
Risk
Summary
The above results can be summed up in a single sentence:
Silver is consistently twice as volatile than gold but is only ocassionaly rewarding.
Therefore investment in silver should be tactical (including trading) with appropriate indicators. Buying and holding silver for returns/diversification can be twice as frustrating than gold.
References
- Silver price data
- Gold price data (USD INR exchange rate history can also be obtained here)
- Some interesting gold and silver charts