Last Updated on August 22, 2022 at 11:16 pm
On Jan 2nd 1979, Gold per troy ounce (about 31.1 grams) was Rs. 1792.85. On 24th July 2020, 41 years later (41.6 years technically), the price was Rs. 142343.67. That is a CAGR or an annualized return of 11.1%. There is however a catch though.
Announcement: A new seminar is available: How to construct a long-term investment portfolio – a guide for beginners. You can sign up via this form. This is meant for absolute newbies to start investing in the right way, asking the right questions and not make the mistake of choosing products in the very first step and repent later!
During the above-mentioned period, Gold in terms of USD moved from 226.8 to 1,902.1. An annualised return of 5.25%. So catch (no 1) is, most of the returns for Gold in INR over the last four decades has been from exchange rate appreciation.
🔥Secure your future with our Robo-advisory tool trusted by over 3,500 investors and advisors. From effortless retirement planning to funding your children’s biggest dreams, turn your financial goals into reality. 🔥
Subscribe for money management solutions via email! (Link takes you to our email sign-up form) Join 32,000+ readers in our community.
👉 New Tool Alert! NaviPlan: A Privacy-Focused Multi-asset Tracker and Goal Planner 👈
Over the last four decades, India has changed quite a bit. In the 80s, India was a closed economy heading towards bankruptcy. In the 90s it was arm-twisted into opening the economy. The Rupee lost tremendous value, the government was almost bankrupt (why do you think EPF, PPF rates were 12%-ish then? Credit risk!) and India was emerging as a major tech player.
We then saw the stock market soar in the 2000s only to be interrupted by the “global” financial crisis. While inflation in the US dropped sharply in the 1980s has been stable since then, inflation in India has been uncomfortably high most of the time. As we shall see below it is only from the 2000s, Gold-INR has been moving in step with Gold-USD. The point is, much of that 11% return is from our economic reorientation with a Rupee under the mercy of market forces.
One common question I see is, “gold price has always been increasing. Is it not a good investment?” The reason is, people see selected data points (as above) and assume gold will always provide “good returns”. This is how the Gold-INR has moved over the last 41 years.
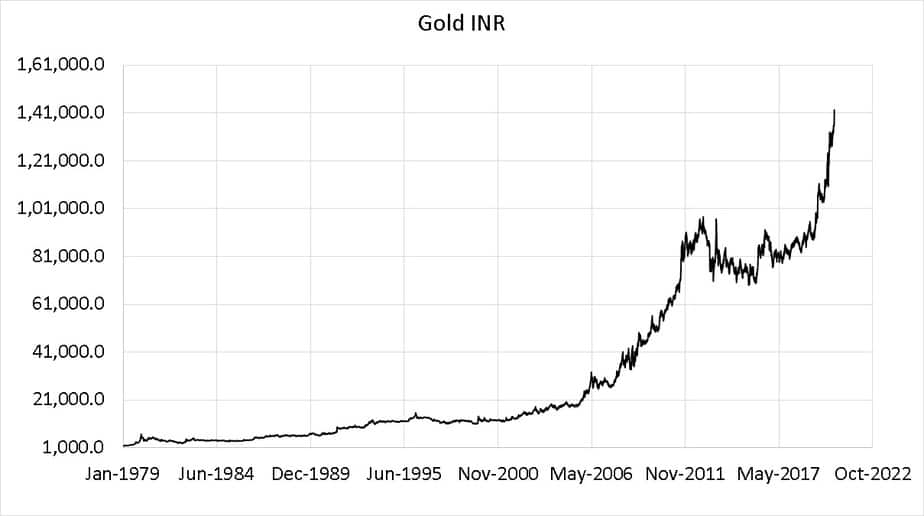
That “looks” spectacular, but not so fast. Let us look at it in log scale so that up and down movements are normalised. The regions in “red” show periods in which the prices have fallen down for extended periods -years!
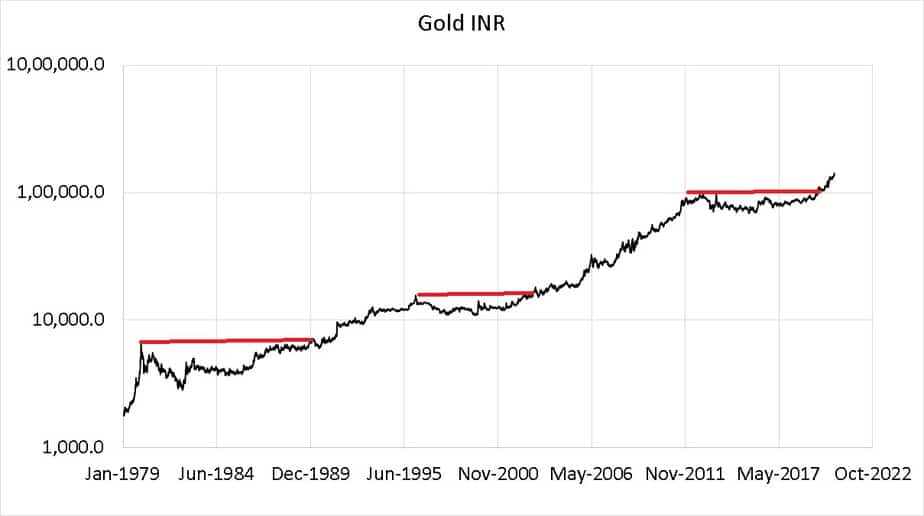
The resemblance with Sensex is uncanny: Are you ready to climb the Sensex Staircase?! So the catch no 2 is with regard to how the annualized return is calculated. It just used the start and end prices ignoring the movement in the middle.
India had a “golden decade” bet 1979 to 1989 for those who wished to accumulate physical gold. We also another 5-6 years where the price was “underwater” (less than the peak). So this 11% over 41 years is simply a case of cherry-picked hindsight bias useful only for WhatsApp forwards.
To understand how the exchange rate is key reason for gold-INR returns for the first two decades of the last 41 years, let us look at the normalised movement of gold-INR, gold-USD and INR-USD

From 1979 to mid-2007 gold-USD was “underwater” – that is an astonishing 25-26 years!! Gold-INR moved up for the most part of this period only because the rupee suddenly became market-linked and progressively grew weaker against the dollar.
Let us look at the same cherry-picked dates as above. If we normalise gold-INR, gold-USD and INR-USD to a vale of “one” on 2nd Jan 1979, on 24th July 2020, gold-INR grew to 79.4! Gold-USD to 8.4 and most amusingly INR-USD to 9.4. No better way to identify the key driver as the exchange rate.
From 2000 onwards, gold-INR has been in more or less in step with gold-USD. This means the “alpha” from the exchange rate has reduced significantly and has become steady (a sign that our economy is in better shape).
We pointed out catch no 2 was the extended periods of gold price trading below a maximum. This results in huge investment risk for those who invest in gold for returns (accumulation for consumption is not an investment).
The disparity in gold-INR and gold-USD movement can be seen in five-year rolling returns (white window).
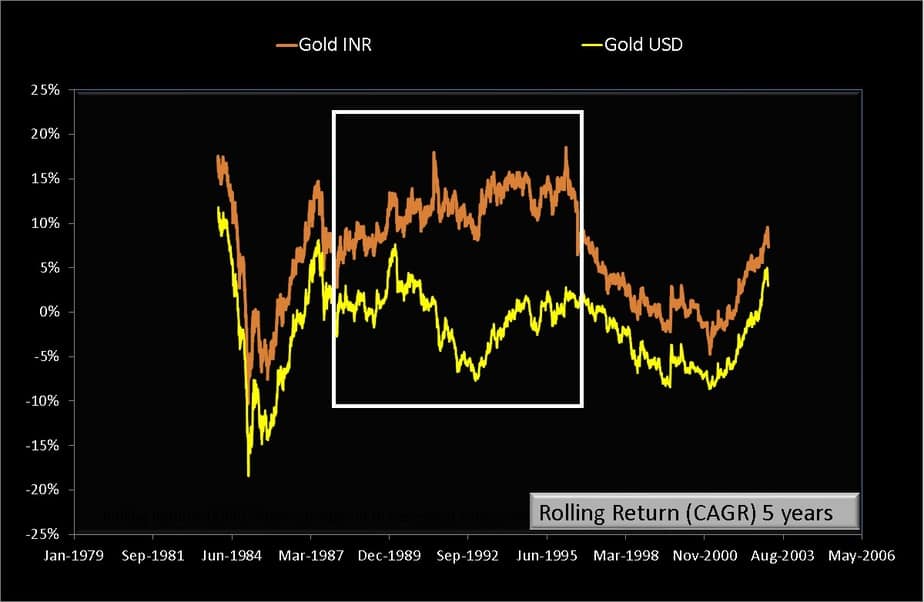
In case you are wondering what return you would get by holding a sovereign gold bond 8 years, the answer is, “we do not know”. It is pot luck. The returns can fluctuate wildly. Gold is just as risky as stock if not riskier!

The 15-year rolling returns tell you how the exchange rate “benefit” has significantly reduced in the last decade.
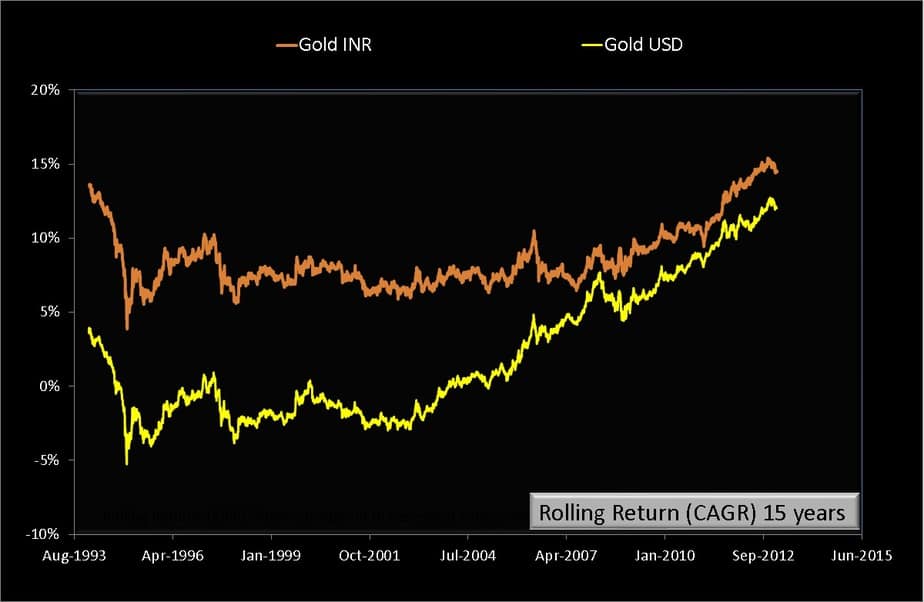
15 year rolling returns of Gold-INR and Gold-USD from Jan 2nd 1979 to July 24th 2020Summary: Investors should not look at random price data and make conclusions about risk and reward. They should look at past performance want to enter an asset class. A sound investment strategy is essential. You can check out our past articles on gold to do this:
- Sovereign Gold Bond Scheme 2020-21: When to use and when not to!
- Will including gold in my portfolio help?
- Is this a good time to buy gold? A tactical buying strategy for gold