In this edition of the “fund performance report”, we look at Canara Robeco Flexi Cap Fund. Launched in Sep 2003, the fund has an AUM of about Rs. 7,256 Crores. We shall compare the reward and risk performance consistency of the fund with respect to Nifty 500 TRI and Nifty LargeMidcap 250 TRI. The fund was earlier known as Canara Robeco Equity Diversified Fund.
Disclaimer: Fund performance reports present return and risk analysis of a fund with representative benchmarks and not investment recommendations. It must be expressly understood that the data below reflect only past performance and is in no way an indication of future performance. Our investment recommendations can be found here: Handpicked List of Mutual Funds (PlumbLine).
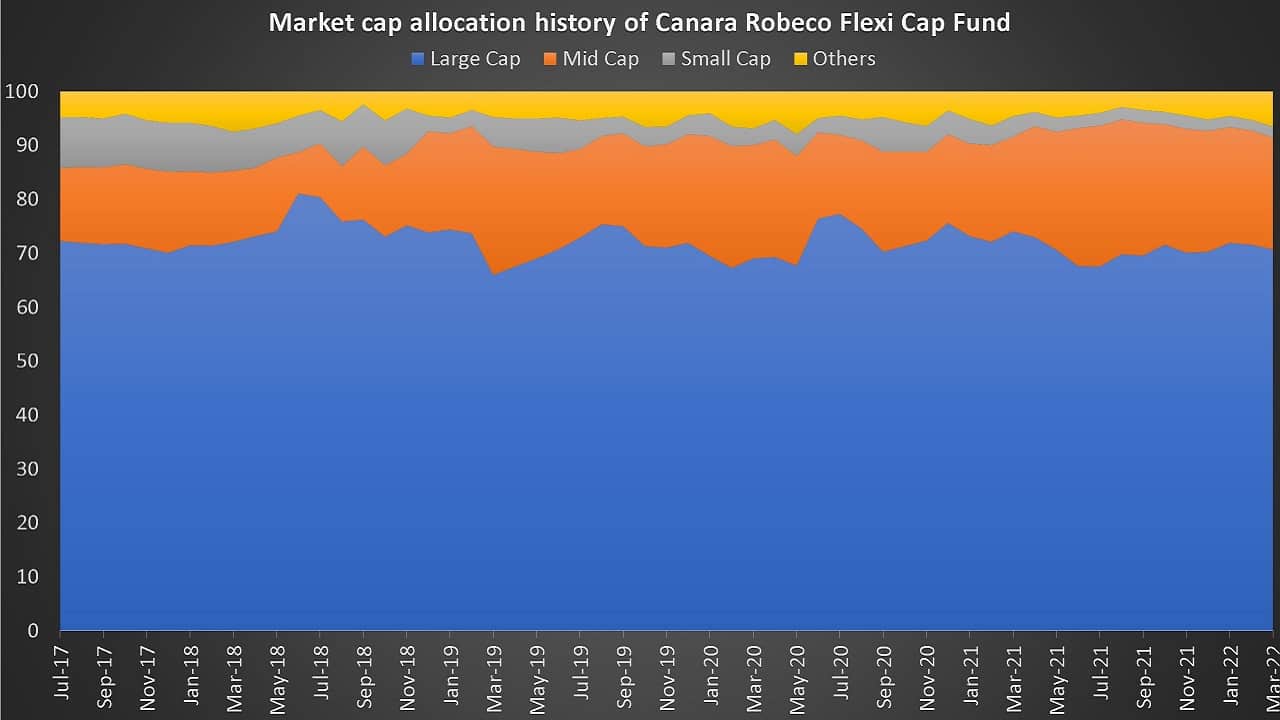
As we can see from the market cap allocation history of the fund, it has had a fairly stable large-cap oriented portfolio although it has had the freedom to change it at will.
We will use three metrics to analyze performance consistency versus benchmarks. Analysis such as this can be found for 350+ equity funds in our monthly mutual fund screener.
Note: NIfty 500, NIfty 200 or NIfty 100 are only market cap-weighted. The Nifty LargeMidcap 250 index has 50% of large caps and 50% of midcaps in addition to being market cap-weighted.
🔥Secure your future with our Robo-advisory tool trusted by over 3,500 investors and advisors. From effortless retirement planning to funding your children’s biggest dreams, turn your financial goals into reality. 🔥
Subscribe for money management solutions via email! (Link takes you to our email sign-up form) Join 32,000+ readers in our community.
👉 New Tool Alert! NaviPlan: A Privacy-Focused Multi-asset Tracker and Goal Planner 👈
1 Rolling return outperformance consistency: the fund returns are compared with category benchmark returns over every possible 3Y,4Y, 5Y period. Higher the outperformance consistency, the better. Suppose 876 fund returns were compared with 876 benchmark returns, and the fund has beaten the benchmark 675 times. The consistency score will be 675/876 ~ 77%.
Three Years
| Metric | Nifty Largemidcap 250 TRI | Nifty 500 TRI |
| No of rolling return entries Index (3 Years) | 1541 | 1545 |
| No of rolling return entries Fund (3 years) | 1541 | 1545 |
| No of times the fund has outperformed the index (3 years) | 784 | 817 |
| rolling return outperformance Consistency Score (3 years) | 51% | 53% |
Four years
| Metric | Nifty Largemidcap 250 TRI | Nifty 500 TRI |
| No of rolling return entries Index (4 Years) | 1293 | 1297 |
| No of rolling return entries Fund (4 years) | 1293 | 1297 |
| No of times the fund has outperformed the index (4 years) | 620 | 691 |
| rolling return outperformance Consistency Score (4 years) | 48% | 53% |
Five years
| Metric | Nifty Largemidcap 250 TRI | Nifty 500 TRI |
| No of rolling return entries Index (5 Years) | 1047 | 1050 |
| No of rolling return entries Fund (5 years) | 1047 | 1050 |
| No of times the fund has outperformed the index (5 years) | 536 | 795 |
| rolling return outperformance Consistency Score (5 years) | 51% | 76% |
That is just about “coin toss” (50-50) consistency. Considering the fund’s market cap allocation history, perhaps the NIfty 500 is a better benchmark, but even here the consistency over 3Y and 4Y is not great. This means investors will have to keep the faith with the fund manager for at least 5Y or more.
We can see this from the trailing returns as well.
| Metric | Nifty 500 TRI | Trailing Fund Return 1Y |
| 1Y | 24% | 22.37% |
| 2Y | 45% | 39.10% |
| 3Y | 18% | 20.43% |
| 4Y | 15% | 17.65% |
| 5Y | 15% | 17.26% |
| Metric | Trailing Nifty LargeMidcap250 Returns | Trailing Fund Return 1Y |
| 1Y | 24.21% | 22.69% |
| 2Y | 51.68% | 42.11% |
| 3Y | 19.58% | 20.30% |
| 4Y | 15.41% | 18.10% |
| 5Y | 15.76% | 17.54% |
The results against the two benchmarks were computed a few days apart and hence the difference in the fund returns.
2 Upside performance consistency over every possible 3Y,4Y, 5Y: Higher the better. A score of 70% means, 7 out of 10 times, the fund performed better than the category benchmark when the benchmark was moving up. This is a measure of reward. It is computed from rolling upside capture data (see link below).
| Metric | Nifty Largemidcap 250 TRI | Nifty 500 TRI |
| upside performance consistency (3 years) | 49% | 72% |
| upside performance consistency (4 years) | 53% | 80% |
| upside performance consistency (5 years) | 46% | 90% |
The fund typically does better than the NIfty 500 when the index moves up. This is not the case with Nifty LargeMidcap250 TRI.
3 Downside performance consistency over every possible 3Y,4Y, 5Y. Higher, the better. A score of 60% means, 6 out of 10 times, the fund performed better than the category benchmark when the benchmark was moving down. This is a measure of risk protection. It is computed from rolling downside capture data. Read more: An introduction to Downside and Upside Capture Ratios.
| Metric | Nifty Largemidcap 250 TRI | Nifty 500 TRI |
| downside protection consistency (3 years) | 92% | 83% |
| downside protection consistency (4 years) | 97% | 94% |
| downside protection consistency (5 years) | 100% | 98% |
The fund tends to fall less than both benchmarks when they are falling but this alone without consistent performance does not mean much.
In summary, Canara Robeco Flexi Cap Fund is just about an average performer suitable for those who prefer a “quiet fund” (away from the limelight) willing to bet that it will beat the Nifty 500 over about 5Y or more.