Last Updated on September 4, 2022 at 8:03 am
A reader writes, “Sir, I recently read your article – Sensex vs S&P 500 vs Nasdaq 100: Which is better for the long term? In this, you have plotted the S&P 500 and the Nasdaq 100 in INR terms. Is there a way to quickly make such a comparison on our own?”
As far as we know, there is no quick way to compare S&P 500 and the Nasdaq 100 in INR terms with the Sensex or the Nifty (like the chart compare feature on Google Finance, Value Research, Moneycontrol etc.).
However, there is a way around it in USD terms. The S&P BSE DOLLEX 30 is the Sensex in USD, and the NIfty equivalent is Nifty Defty, now called Nifty 50 USD. So this allows comparison in USD terms. Naturally, the forex component has to be added for the final return but for a quick comparison of market movement, this would suffice.
Caution: Do not base investment decisions on trailing return charts alone. A rolling returns study (linked above) would be much more instructive.
🔥Secure your future with our Robo-advisory tool trusted by over 3,500 investors and advisors. From effortless retirement planning to funding your children’s biggest dreams, turn your financial goals into reality. 🔥
Subscribe for money management solutions via email! (Link takes you to our email sign-up form) Join 32,000+ readers in our community.
👉 New Tool Alert! NaviPlan: A Privacy-Focused Multi-asset Tracker and Goal Planner 👈
S&P 500 vs Sensex in USD
- Go to https://www.spglobal.com/spdji/en/
- Search for S&P 500
- In the graph view tab, you will see a “compare” button
- Click that and enter “S&P BSE DOLLEX 30” (without the quotes)
- You can now compare both indices for up to 30 years and download total returns or price data normalised for up to 10 years
These are the last 3y, 5Y and 10Y comparison screenshots as on 26th Aug 2022.
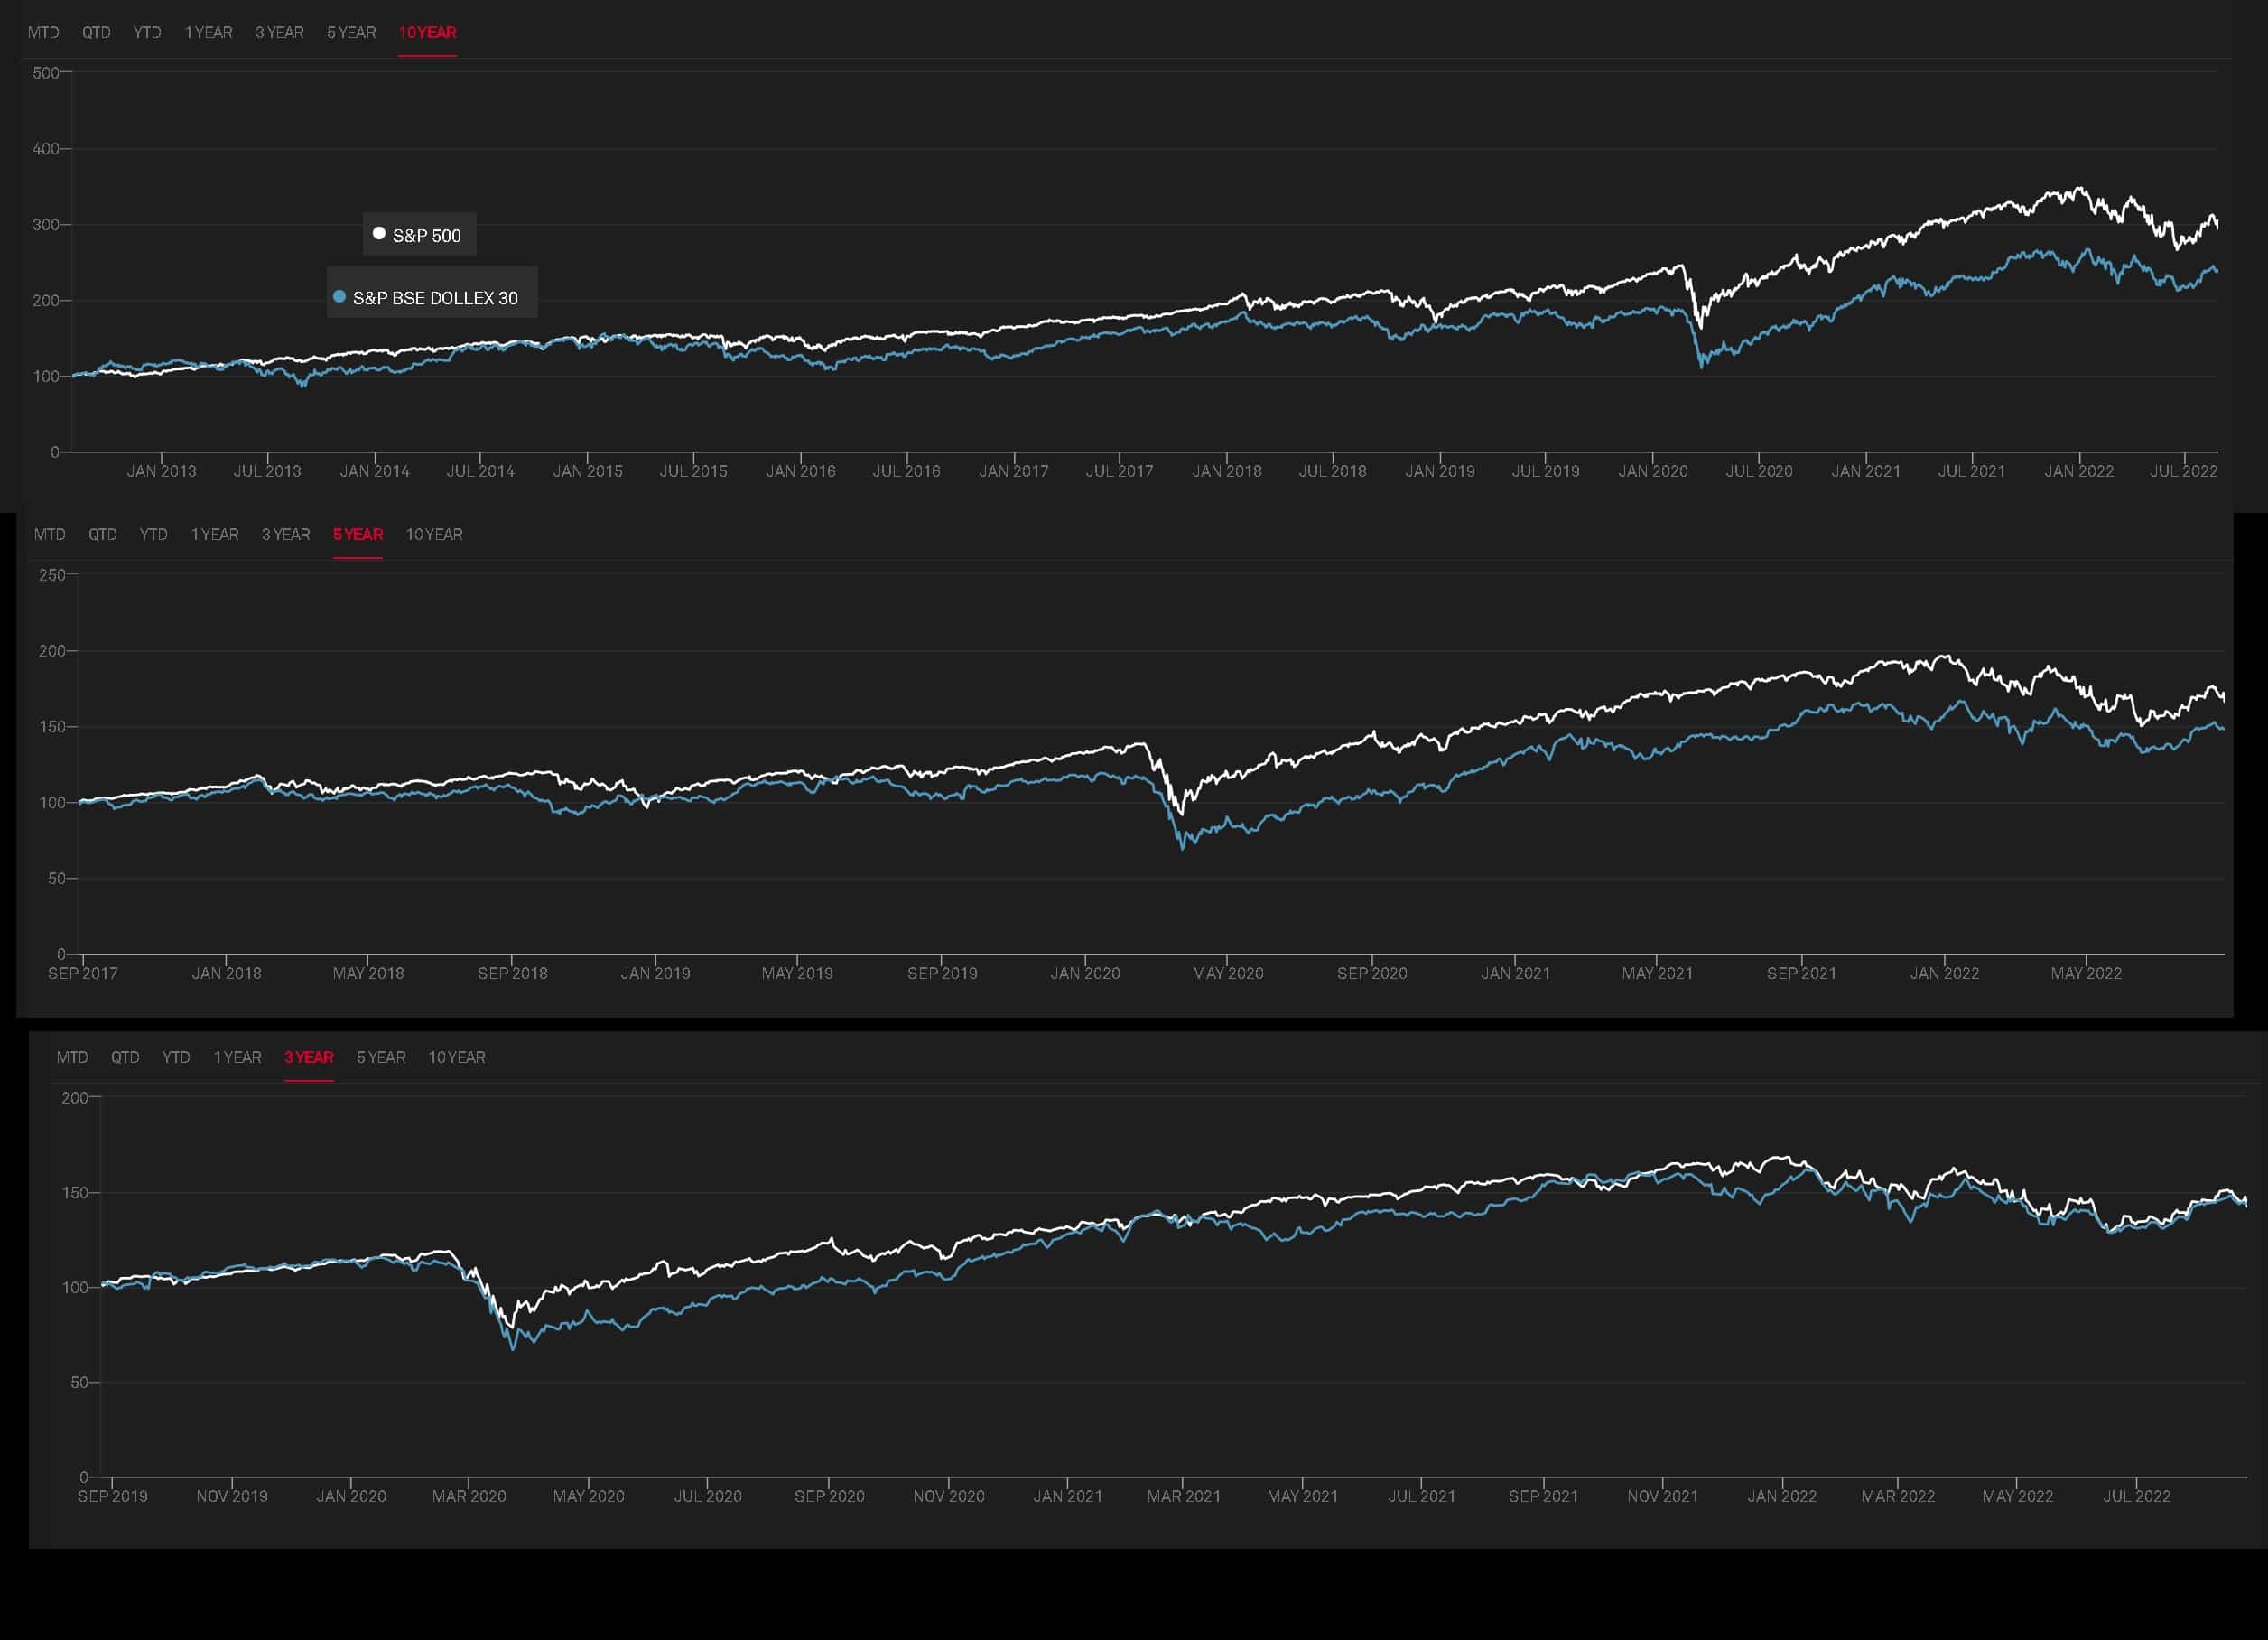
Notice that the S&P 500 has outperformed the Sensex over the last 10Y and 5Y. However, those were gains were obtained 3Y ago. Over the last 3Y, both indices have been more or less similar (at the time of writing).
So now, those who sought US indices for “returns” in the name of diversification will truly enjoy the benefits of diversification. That is, the outperformance of the Sensex wrt S&P 500 (or vice versa) is cyclic with unknown frequency.
Sensex vs Nifty vs S&P 500 or Nasdaq 100 etc.
- Go to https://in.investing.com/indices/s-p-cnx-defty-advanced-chart
- This will take you to the Nifty 50 in USD advanced chart tab.
- Set the chart type to “line”.
- Add other indices using the “compare” tab.
- This will take some time to get used to unless you have experience with trading tools.
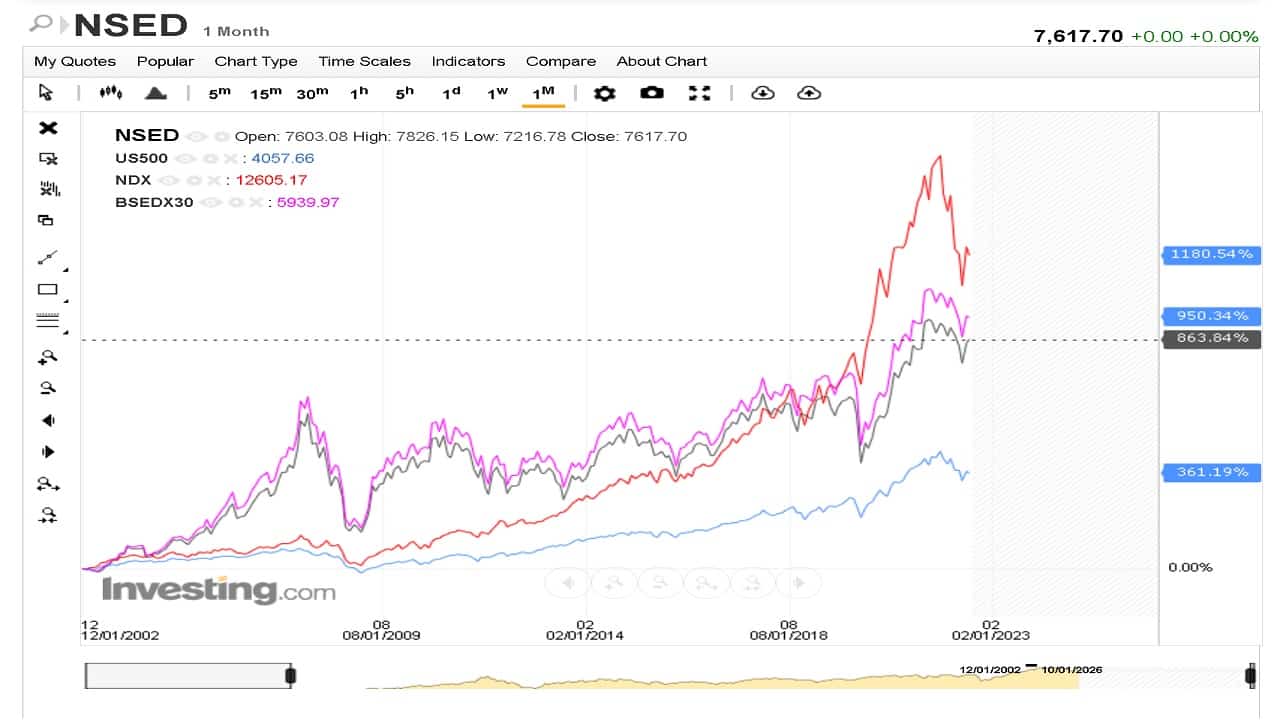
This is a screenshot. You can change the duration using the slide just below the chart.
If you know of other ways to make this comparison, tweet them to @freefincal or @pattufreefincal