Last Updated on December 29, 2021 at 6:26 pm
In response to our article, “Do we need to invest in international mutual funds?“, a reader claimed that the Nasdaq 100 or the S&P 500 would beat the Sensex over the long term for sure. Is this just another opinion based on personal faith, or does it have any past performance support?
We find out by comparing the rolling returns of the Sensex total returns index with the S&P 500 Total return index in INR and the Nasdaq 100 total return index in INR.
There is a difference in the way in which capital gains and dividends of these indices are taxes. Therefore we decide to ignore taxes in this comparison. It would be safe to assume that the US-based index return would be lowered by about 10% due to tax. In addition, the expense ratio will have to be considered.
Let first start with Sensex TRI vs S and P 500 TRI in INR vs Nasdaq 100 TRI in INR since 5th March 1999.
🔥Secure your future with our Robo-advisory tool trusted by over 3,500 investors and advisors. From effortless retirement planning to funding your children’s biggest dreams, turn your financial goals into reality. 🔥
Subscribe for money management solutions via email! (Link takes you to our email sign-up form) Join 32,000+ readers in our community.
👉 New Tool Alert! NaviPlan: A Privacy-Focused Multi-asset Tracker and Goal Planner 👈
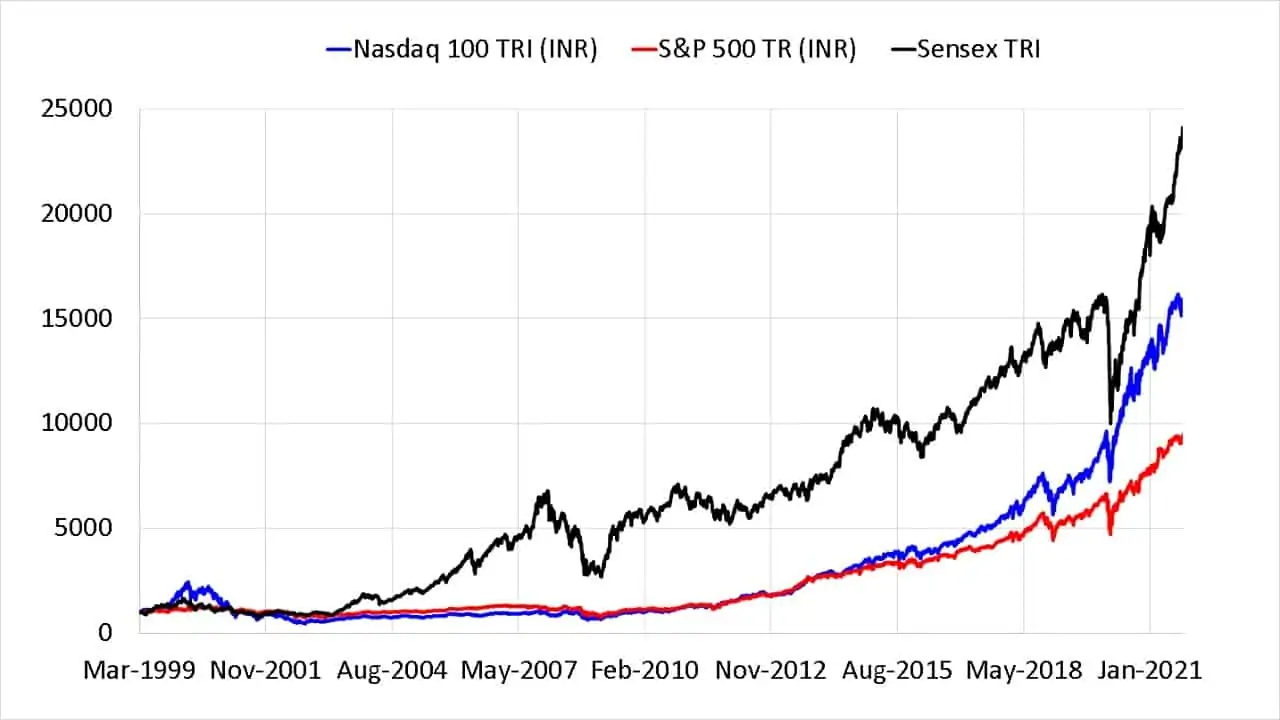
Sensex has done quite well in the last two decades, but let us dig deeper with 5, 10, 15 and 20-year rolling returns. The number in the small grey box within the chart represents the number of rolling returns data points for the Sensex.
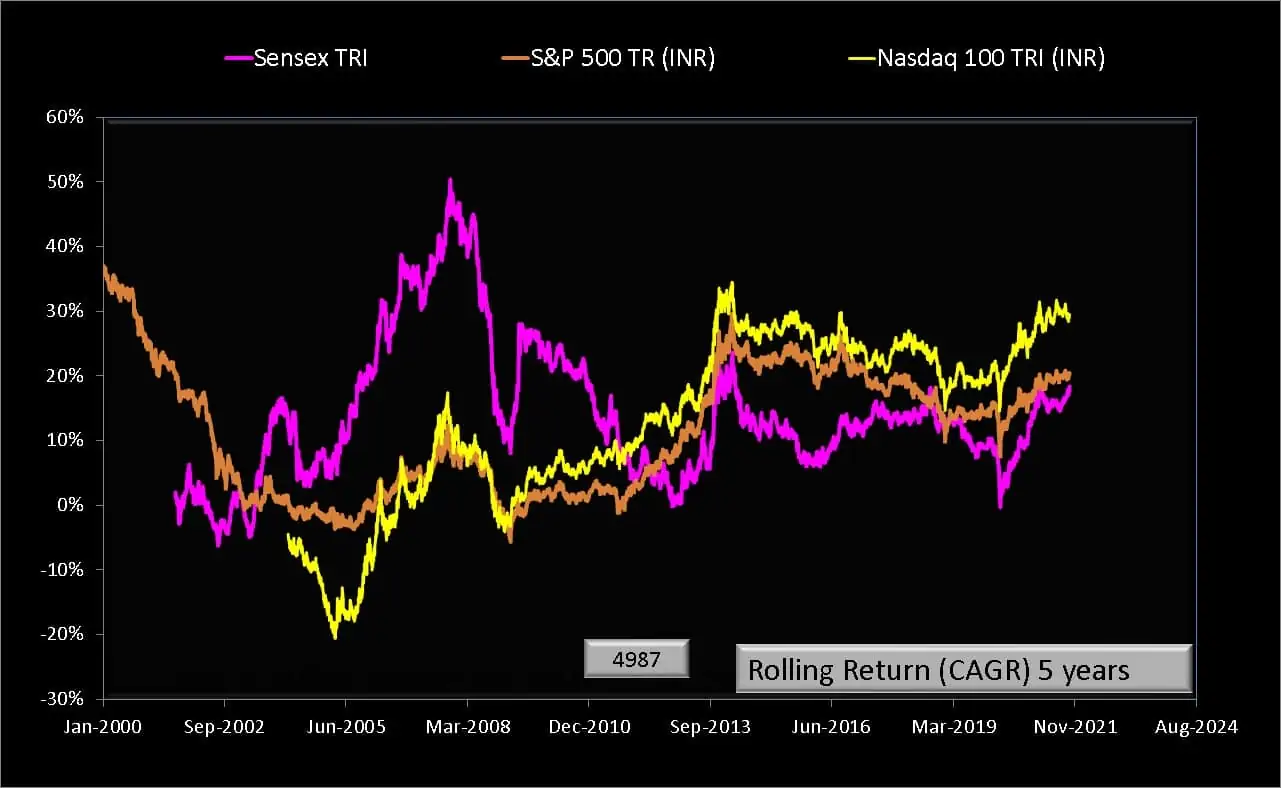
We can expect the S&P 500 to outperform the Sensex in the ’90s when our economics and politics were turbulent. For about ten years, the Sensex outperformed both the US indices. The tide again turned from late 2013. This is the key takeaway from this comparison. The performance will be cyclic but with an unknown frequency.
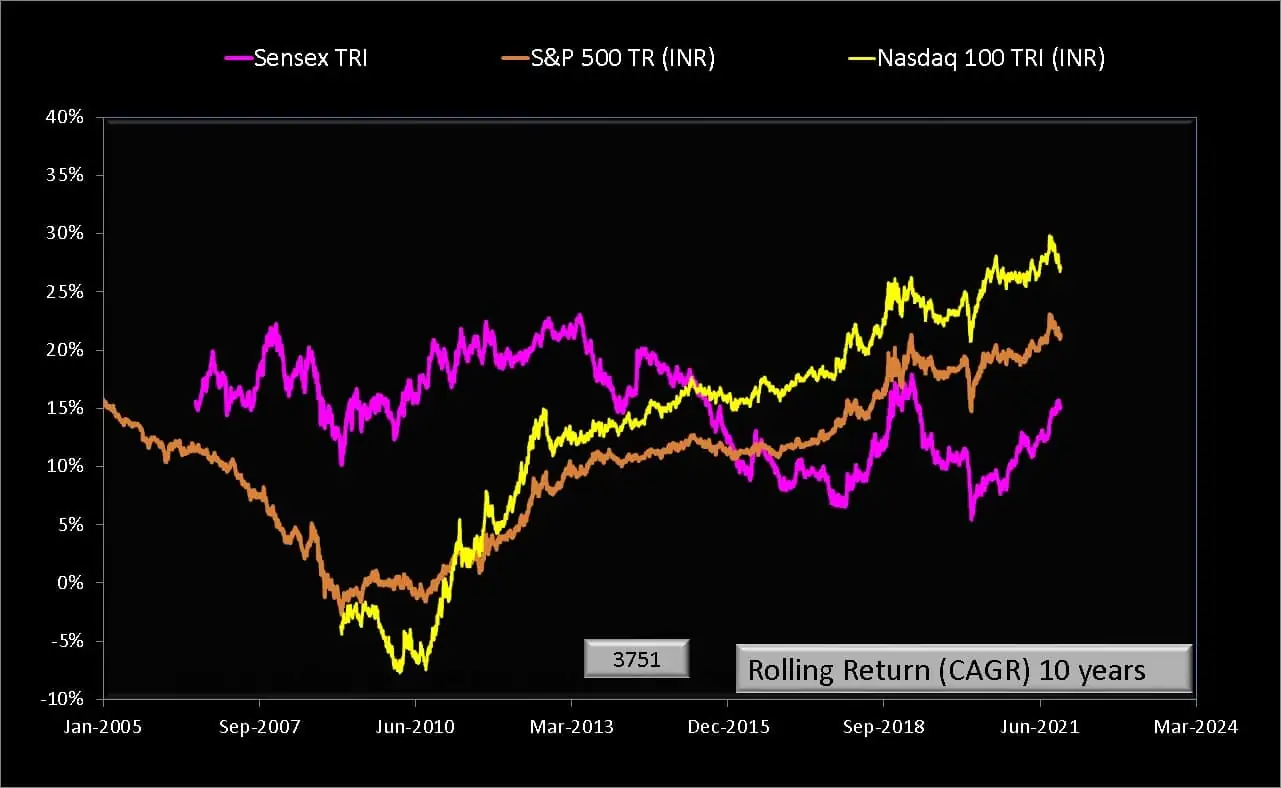
The recent outperformance of the US-indices is again seen in the 10-year rolling returns chart.
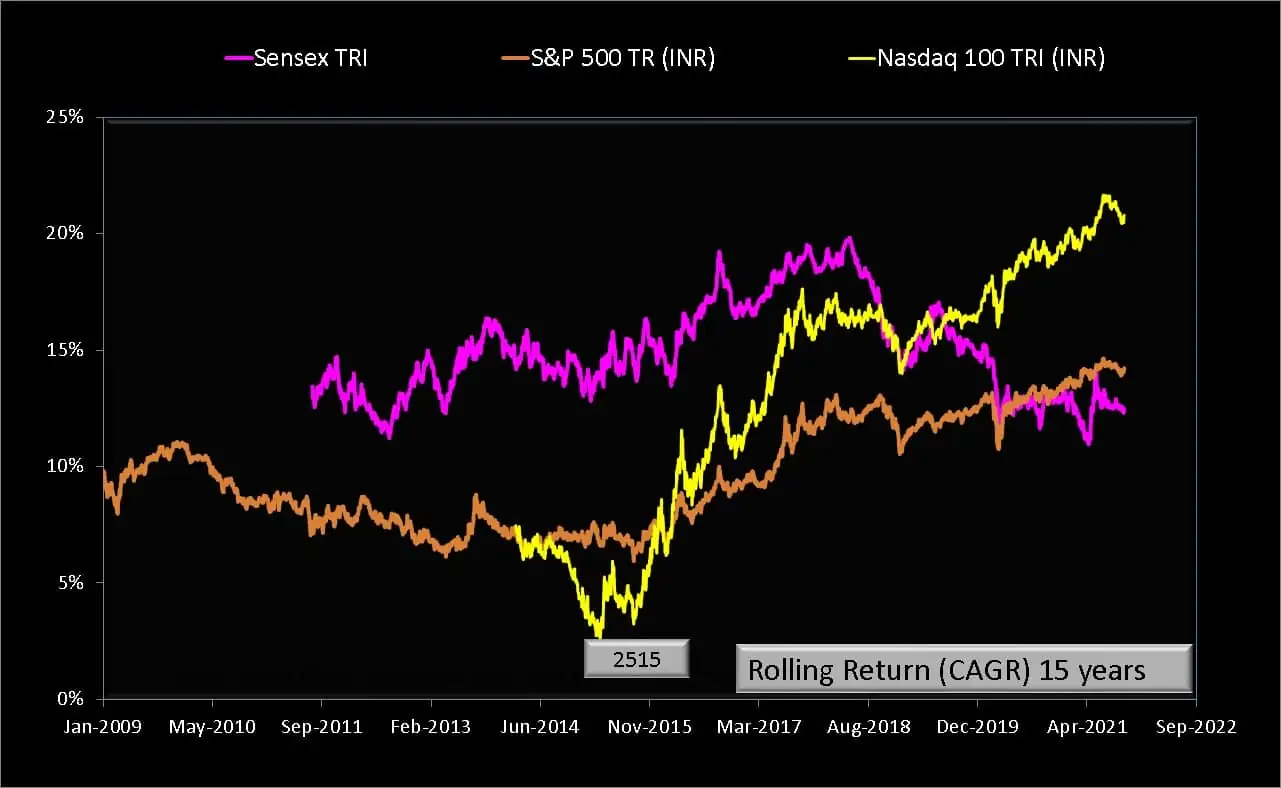
You can appreciate why investors now want a piece of the Nasdaq 100 or the S &P 500. Since late 2017, the 15-year Sensex return has been southward bound while the US-indices, particularly the Nasdaq 100, has been moving up. It would be prudent to expect cyclic behaviour over this tenure as well.
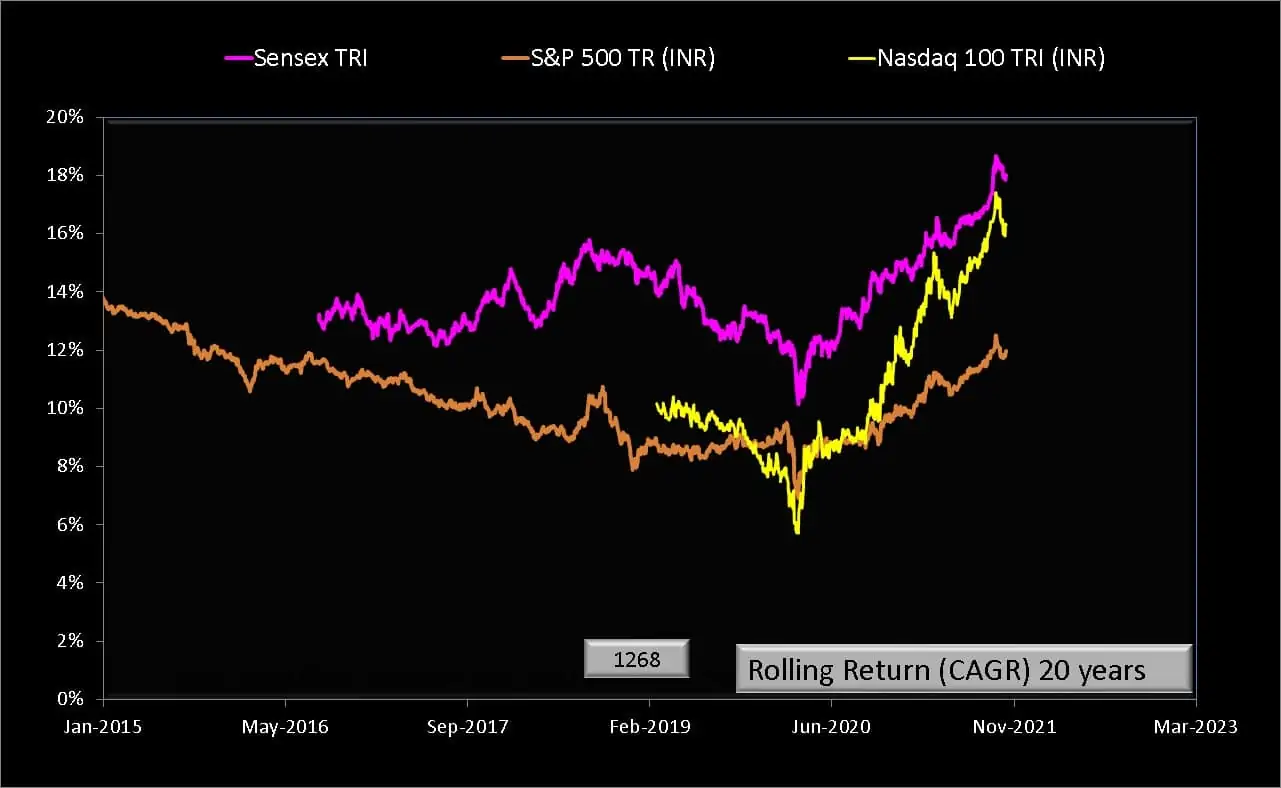
The S&P 500 is significantly lower than that of the Sensex. The Nasdaq 100 has narrowed the gap in the recent past but is just a bit short (taxes and expense ratio would lower this further). In future, the US-indices can beat the Sensex over this tenure, or it may not happen for some time to come. To state the obvious, we do not know.
So the point is, the reader’s claim that the US-indices will comfortably beat the Sensex over the long-term has no past performance support. Does it have intuitive support? Just because the NASAQ 100 or the S&P 500 is dominated by tech giants with a global footprint today, can we expect these indices to beat the Sensex? It is possible but only just as probable as the opposite scenario.
The above gives some confidence that sticking to Indian equity is not such a bad deal. There is a reasonable chance of beating inflation with it. See: Why should I invest in equity mutual funds when there is no guarantee of returns?
Now let us consider the idea of diversification with US indices. Quants would like to measure this in terms of correlation factors. IMO the only metric that is easy to appreciate is the one-year return which we can see easily from a rolling returns chart. One year because this is the normal frequency of rebalancing. Looking for correlation over shorter periods may be technically correct but is not helpful to a common investor.
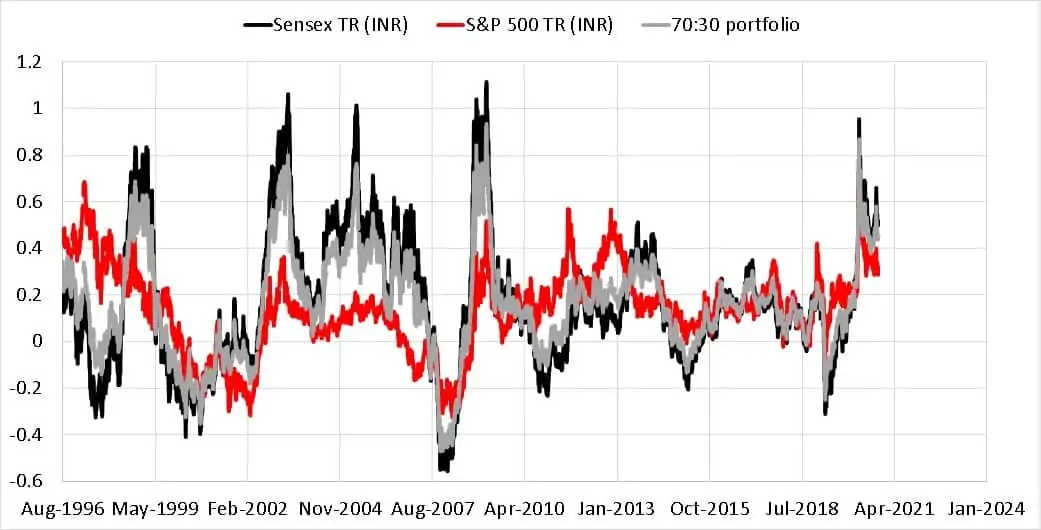
One cannot expect a perfect negative correlation – that is, the S&P 500 giving a positive one-year return when the Sensex return is negative for the same period. This happens sometimes and sometimes not.
If we assume a yearly rebalance between the two equity indices, then for a 30% S&P 500 and 70% Sensex mix, the one-year rolling returns are shown in grey above. The grey line mimics the Sensex with slightly lower returns as it is the dominant contribution. Please note that most investors have much lower international equity exposure. There is, however, one drawback in this illustration: There is no fixed income component involved in the rebalancing.
If the trend shown above continues in the future, considering that the Sensex 1Y return frequently outperforms the 1Y S&P 500 return, increasing the international equity exposure would only limit us from benefiting from the upside potential of Indian equity.
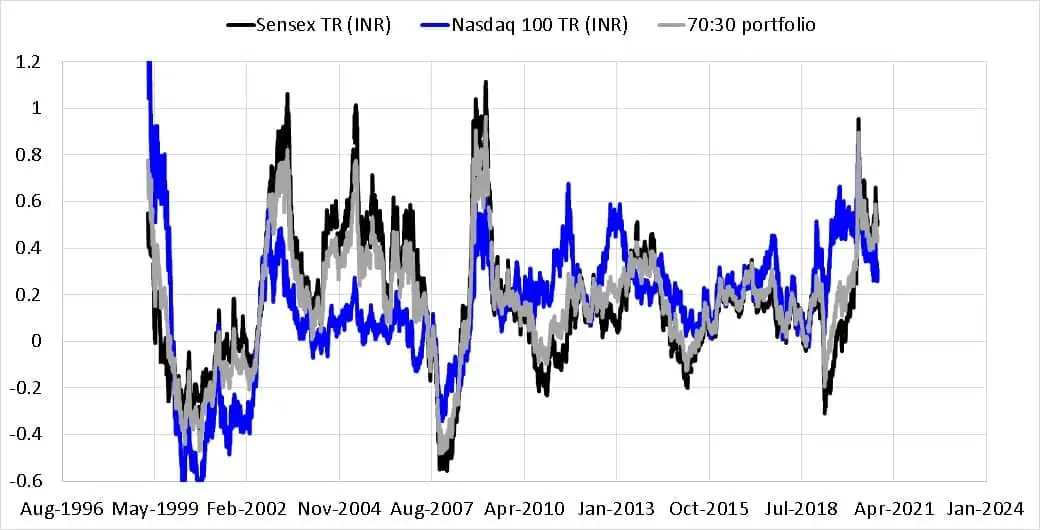
The scenario with Nasdaq 100 is similar, although its upside potential is higher due to its higher volatility.
In summary, one can see that the Sensex performance is reasonably good compared to the S&P 500 and the Nasdaq 100. Investors who wish to only invest in Indian equity are not worse off than those who desire international diversification. The recent outperformance of the US-indices over 5 to 15 year periods may not persist in future. Portfolio diversification, as discussed earlier, comes at a price – higher management fee, higher taxes and maintenance (regular rebalancing). Very few investors are capable of appreciating or implementing this.