Last Updated on September 26, 2022 at 6:03 pm
Mirae Asset S&P 500 Top 50 ETF is an open-ended scheme replicating/tracking S&P 500 Top 50 Total Return Index. Mirae Asset S&P 500 Top 50 ETF Fund of Fund is an open-ended fund of fund scheme predominantly investing in Mirae Asset S&P 500 Top 50 ETF. Both products have an NFO period of 1st September – 14th September 2021. In this review, we discuss what investors should be aware of before considering these passive products.
What is the S&P 500 Top 50 index? The S&P 500 consists of 500 large cap stocks weighted by market capitalization (FYI: the Russell 1000 Index tracks 1000 large cap stocks). As the name suggests, the S&P 500 Top 50 will consist of the top 50 S&P 500 stocks. The S&P refers to this as a mega-cap index.
On the face of it, this seems to check all the right boxes in an investors mind. Only the top 50 stocks instead of 500 – this means more of the tech giants (a focused portfolio always rings some merry bells) but not as concentrated as the Nasdaq 100 or the Mirae Asset NYSE FANG+ ETF (link points to our review).
The top 50 index seems like an index that can provide higher returns than the S&P 500 – the AMC certainly wants us to believe this – with less tracking error. See: Tracking errors of MO S&P 500 Index fund, MO Nasdaq 100 ETF and FoF.
🔥Secure your future with our Robo-advisory tool trusted by over 3,500 investors and advisors. From effortless retirement planning to funding your children’s biggest dreams, turn your financial goals into reality. 🔥
Subscribe for money management solutions via email! (Link takes you to our email sign-up form) Join 32,000+ readers in our community.
👉 New Tool Alert! NaviPlan: A Privacy-Focused Multi-asset Tracker and Goal Planner 👈
We need to dowse the shiny object syndrome glowing brightly in our heads and investigate further. Before we do that, it may be interesting to note that the S&P lists Invesco S&P 500 Top 50 ETF as the only product tracking this index.
Then the Mirae Asset S&P 500 Top 50 ETF would be the second. It is quite possible that this would have a lower tracking error than the S&P 500 index fund from Motilal Oswal, but that would depend on the frequency of trades and how efficiently Mirae’s designated third party arbitrages out the price-NAV deviations.
The situation is similar to how our men’s cricket teams batting strength looks on paper: Rohit, Rahul, Pujara, Kohli, Rahane, Jadeja, Pant. That looks quite investible. Put them in an alien environment, and the results do not reflect the averages.
All these factor indices, segmented indices may look good on paper (we shall if that is true below) but package them into an ETF – the price-NAV deviations can be frustrating. Buy the fund of fund, the overall expense ratio may be revolting (also note, the FOF typically buys the ETF at its price, not NAV). Choose the index fund, then the tracking error can be nauseating.
Therefore, investors must not jump in and buy an ETF or index fund immediately. At the very least, they should wait for a year while studying the expense ratios and tracking errors in the meantime. The same logic will apply to Mirae Asset S&P 500 Top 50 ETF and Mirae Asset S&P 500 Top 50 ETF Fund of Fund.
S&P 500 Top 50 vs S&P 500
Only the last 10 year trailing data is available on the S&P website. The evolution of the net total returns of the S&P 500 and the S&P 500 Top 50 is shown below. Net total return means the dividends are reinvested after accounting for tax. The same will happen for all mutual funds investing in US stocks.
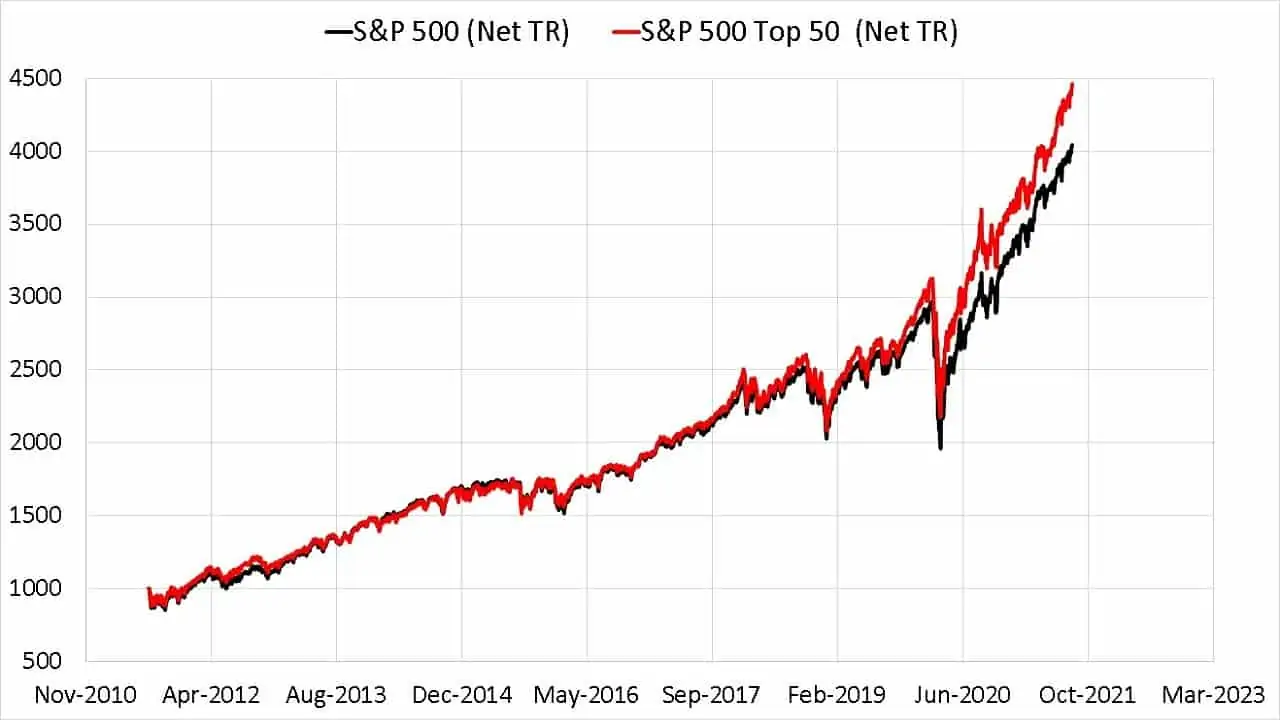
Even a casual glance by the open-minded observer would note that the top 50 outperformance is a recent phenomenon accelerated by the pandemic. The same can also be seen from the three and five-year rolling returns plots.
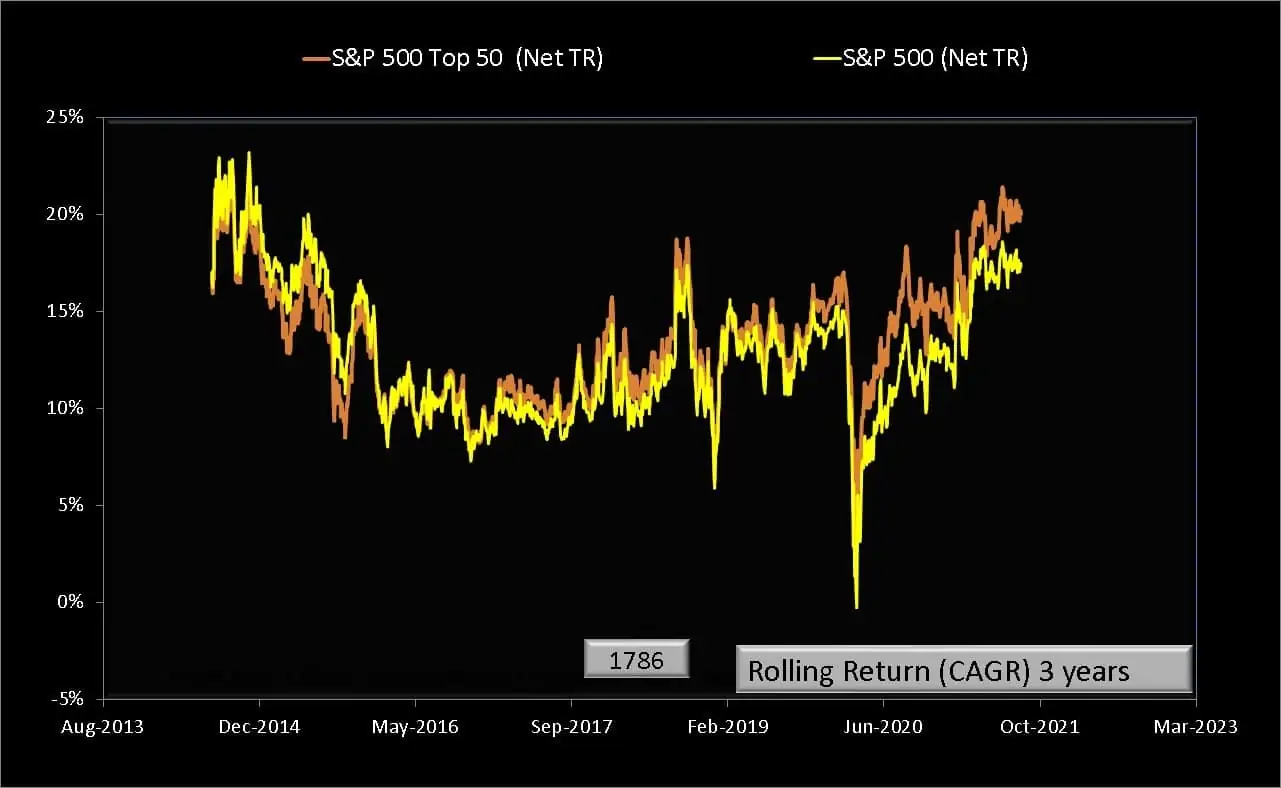
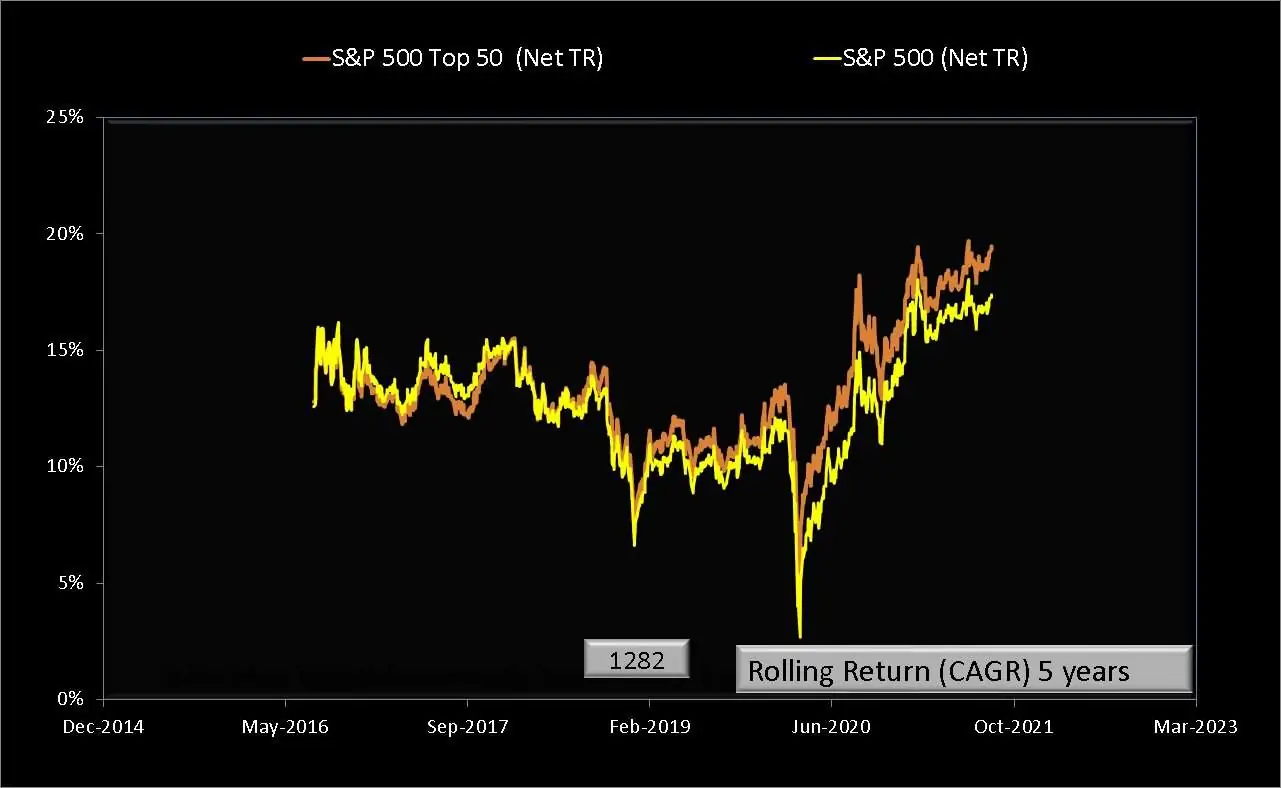
If the top 50 is supposed to be the cream of the S&P 500, then why didn’t it consistently outperform the base index? The answer is a market imbalance – if the base index is held up only by a few stocks during a certain period, the Top 50 would obviously outperform. When the up-move is more homogenous, then the Top 50 does not represent the cream.
This fascination with the top 50 and Fang is essentially recency bias. The experienced investor would know that this is a trend, and all trends can reverse. This can be seen more clearly by using the Invesco S&P 500 Top 50 ETF and iShares Core S&P 500 ETF, for which data is available from 10th May 2005. For those interested, you can pull this data with the entity ticker code and just one command on a Google Sheet. See Data sources for DIY Investing and Analysis for an example.
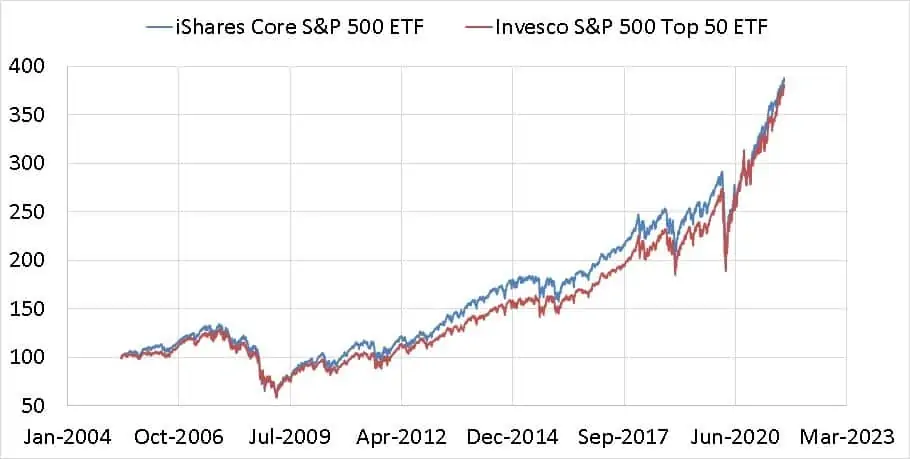
This does not account for the dividends, but at the very least, it should be safe to conclude that the S&P 500 Top 50 does not always outperform the S&P 500. A strong market imbalance is necessary for the top 50 to outperform, and it should be obvious that it will not last forever.
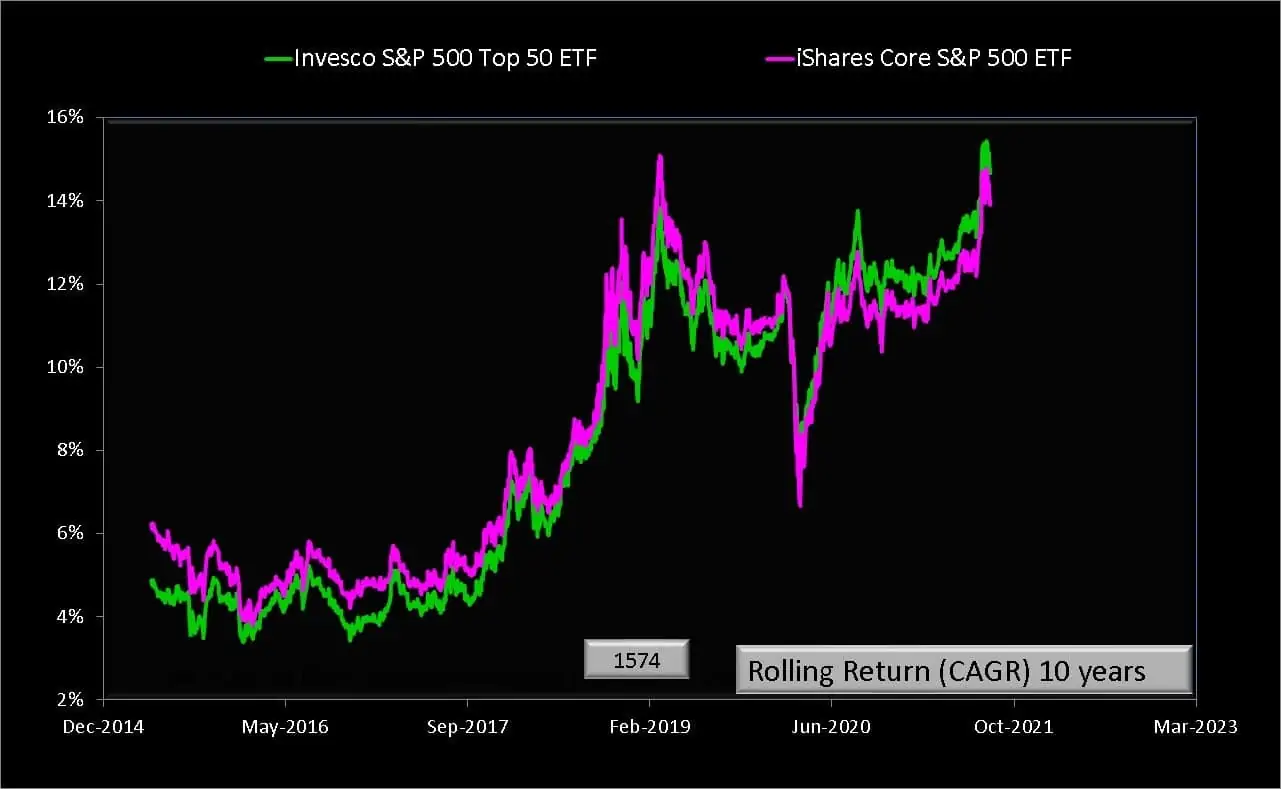
This can also be seen from the ten-year rolling returns (excluding dividends) of both ETFs.
Mirae Asset AMC claims, “The (S&P 500 Top 50) index aims to capture the ever-changing the market trend and reflect the current market leaders from each sector”. It should be clear from the above graphs that this does not result in better performance all the time.
In summary, the Mirae Asset S&P 500 Top 50 ETF may have a lower tracking error relative to an S&P 500 passive product investing directly in the index constituents. However, investors must not always expect the top 50 index to outperform the base index – this is cyclic with unknown periodicity.
The expense ratio of the ETF and fund of fund also matter. We recommend that investors monitor the tracking error, expense ratio and performance of Mirae Asset S&P 500 Top 50 ETF and Mirae Asset S&P 500 Top 50 ETF Fund of Fund for at least one year after listing and then take a call. There is no flaming hurry to fill the AMC’s coffers.