Last Updated on August 11, 2025 at 10:20 am
This article reviews PGIM India Midcap Opportunities Fund, yet another fund to see an AUM boom over the last few months, along with Quant Active Fund and Quant Small Cap Fund. Readers may recall our recent report that PGIM India Midcap Opportunities Fund’s AUM grew by 1212% between March 31st 2020 and May 31st 2021, corresponding to an inflow of about Rs. 1318 Crores – most of its current AUM of Rs. 1615 Crores.
As always, our first step will be to appreciate the history of the fund. We have some help from our earlier review of the PGIM India Global Equity Opportunities Fund. PGIM MIdcap was born as Pramerica Midcap Opportunities Fund in Dec 2013. DHFL Pramercia Midcap Opportunities Fund from Sep 2015 since Dewan Housing Finance Corporation Ltd (DHFL) had purchased a 50% stake in Pramerical Mutual Fund.
Prudential Investment Management (later renamed PGIM) acquired DHFL Pramerica by July 2019. So the fund finally became PGIM India Midcap Opportunities Fund. Surprisingly the fund has remained a midcap fund with the same benchmark all these years.
The fund has seen multiple managers with Aniruddha Naha in charge since April 2018.
🔥Secure your future with our Robo-advisory tool trusted by over 3,500 investors and advisors. From effortless retirement planning to funding your children’s biggest dreams, turn your financial goals into reality. 🔥
Subscribe for money management solutions via email! (Link takes you to our email sign-up form) Join 32,000+ readers in our community.
👉 New Tool Alert! NaviPlan: A Privacy-Focused Multi-asset Tracker and Goal Planner 👈
| Fund Manager | From Date | To Date |
| Mahendra Kumar Jajoo | Dec-2013 | Jun-2014 |
| Ritesh Jain | Jul-2014 | Feb-2016 |
| Brahmaprakash Singh | Dec-2013 | Feb-2016 |
| Akash Singhania | Mar-2016 | Jul-2016 |
| Kumaresh Ramakrishnan | Jul-2016 | Mar-2018 |
| Avinash Agarwal | Aug-2016 | Mar-2018 |
| Aniruddha Naha | Apr-2018 | |
| Vivek Sharma | May-2021 |
Today when we look at the trailing returns of the fund, they look impressive (and this is possibly why the AUM started to increase over the last year; see graph below).
| Scheme Name | PGIM India Midcap Opp Fund(G)-Direct Plan | Nifty Midcap 100 – TRI |
| 1 Year | 102.62 | 82.29 |
| 2 Years | 45.15 | 24.61 |
| 3 Years | 26.53 | 15.48 |
| 4 Years | 20.29 | 12.18 |
| 5 Years | 20.88 | 15.28 |
| 6 Years | 16.79 | 13.73 |
| 7 Years | 17.58 | 14.41 |
| Since inception | 20.15 | 19.19 |
However, we must appreciate that from Dec 2013 to Feb 17th 2020 (when the market started falling), the fund had abysmally underperformed the benchmark. Its entire outperformance has originated in the broad market rally from April 2020.
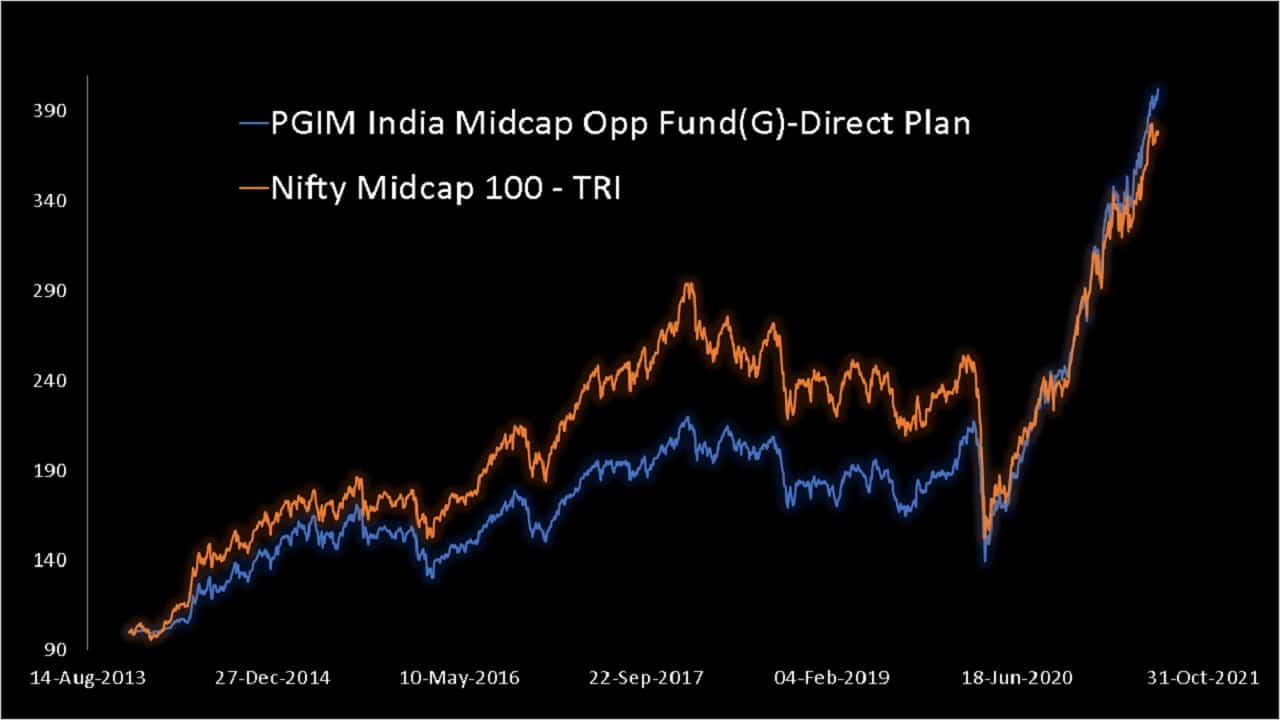
More than six years of severe underperformance (aided by their small cap investments; see below), and then when there is a broad market rally, the fund appears to have outperformed at a casual glance. The performance wrt to BSE Midcap 150 is even worse since inception and over the last seven years, as one can easily from the Value Research fund page.
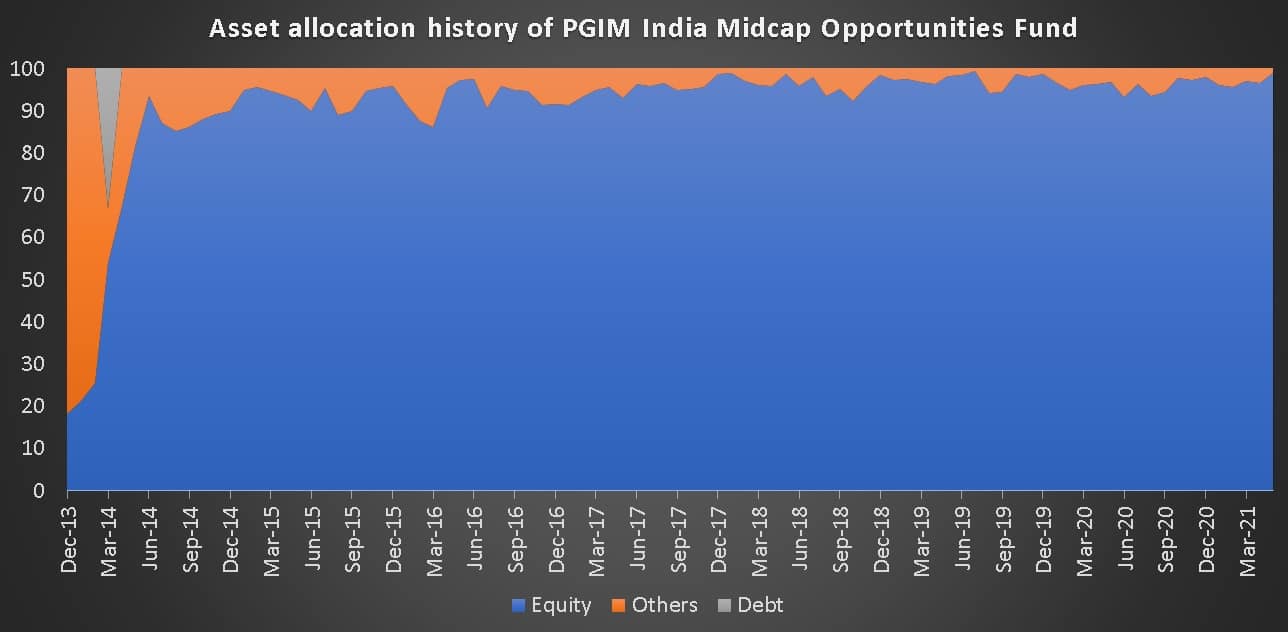
This is the asset allocation history of the PGIM India Midcap Opportunities Fund. Aside from the gradual deployment into equity upon inception, the fund has remained fully invested in equity at all times.
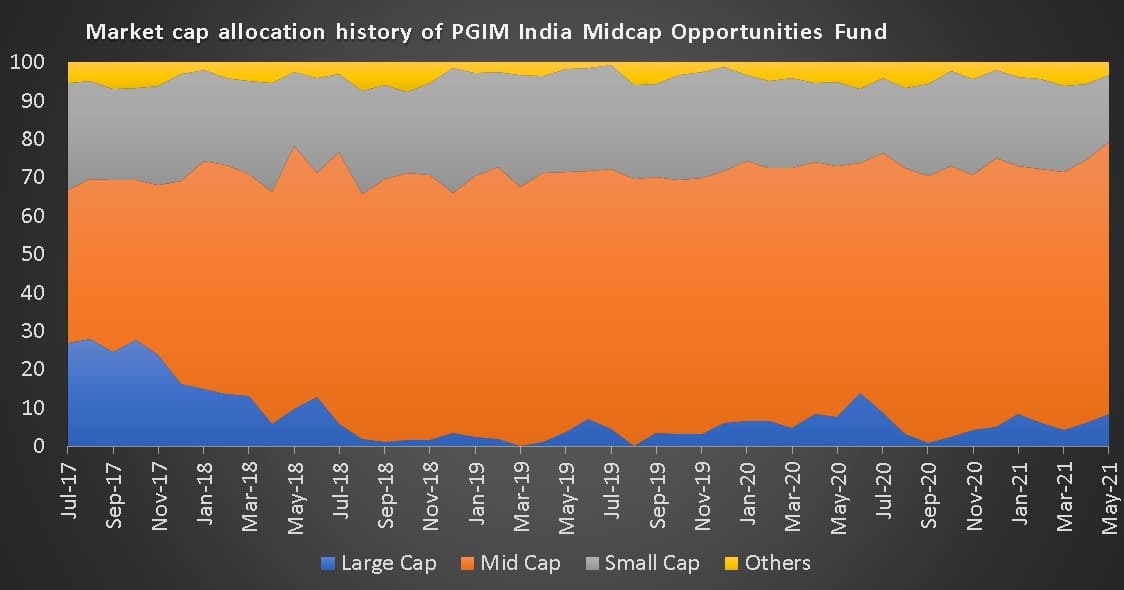
The market cap allocation history is shown below. It is baffling why the fund management insisted on 20%-ish exposure to small caps during a bear market (Feb 2018 to Mar 2020), increasing the margin of underperformance.
The expense ratios of the direct plan and regular plan and the AUM inflow -defined as the monthly change in AUM minus the monthly change in NAV – is shown below.
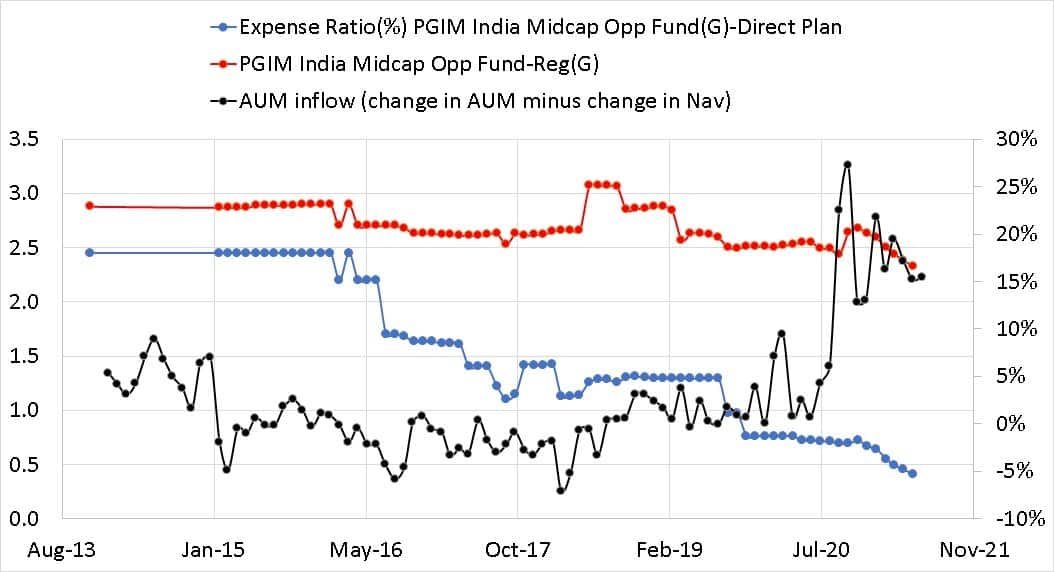
The AMC has constantly decreased the direct plan TER (as was the industry norm + regulations) to invite the direct plan AUM. The spike in the black dots (AUM inflow; right axis) is only from July 2020.
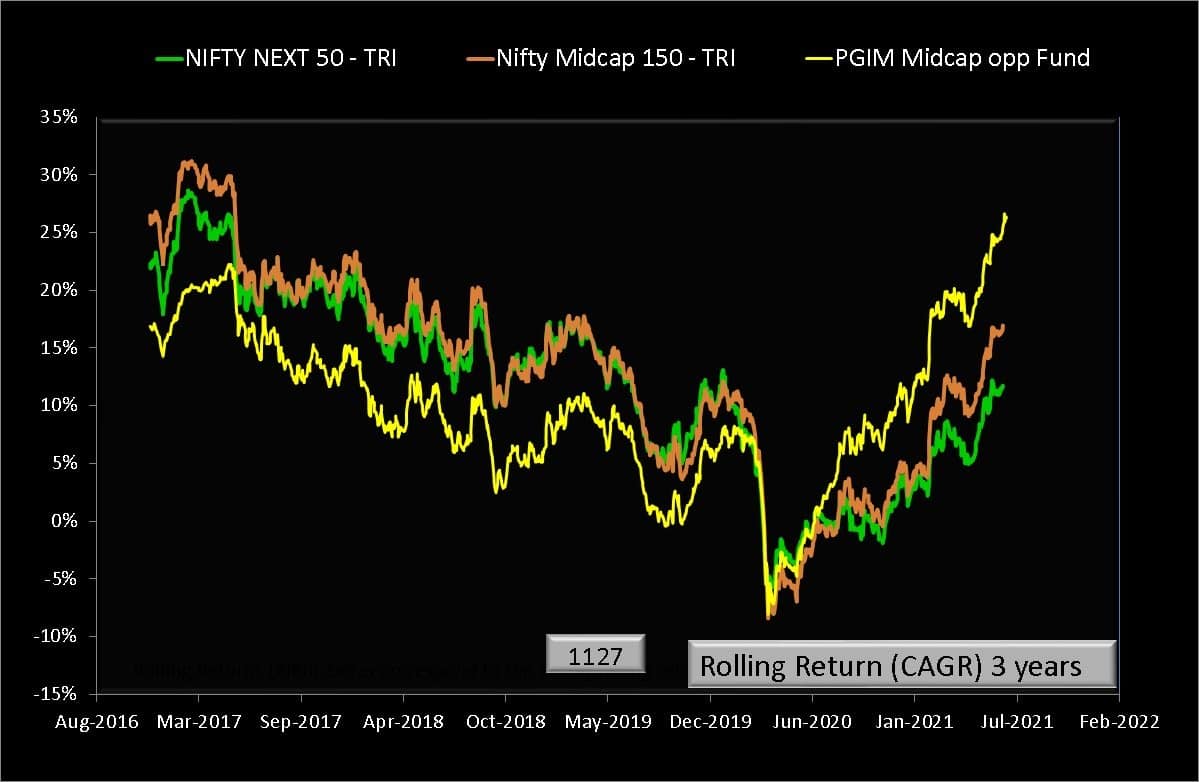
The poor performance can be clearly seen in the three-year rolling returns compared with Nifty Next 50 TRI and Nifty Midcap 150 TRI.
The five-year rolling returns does not great through.
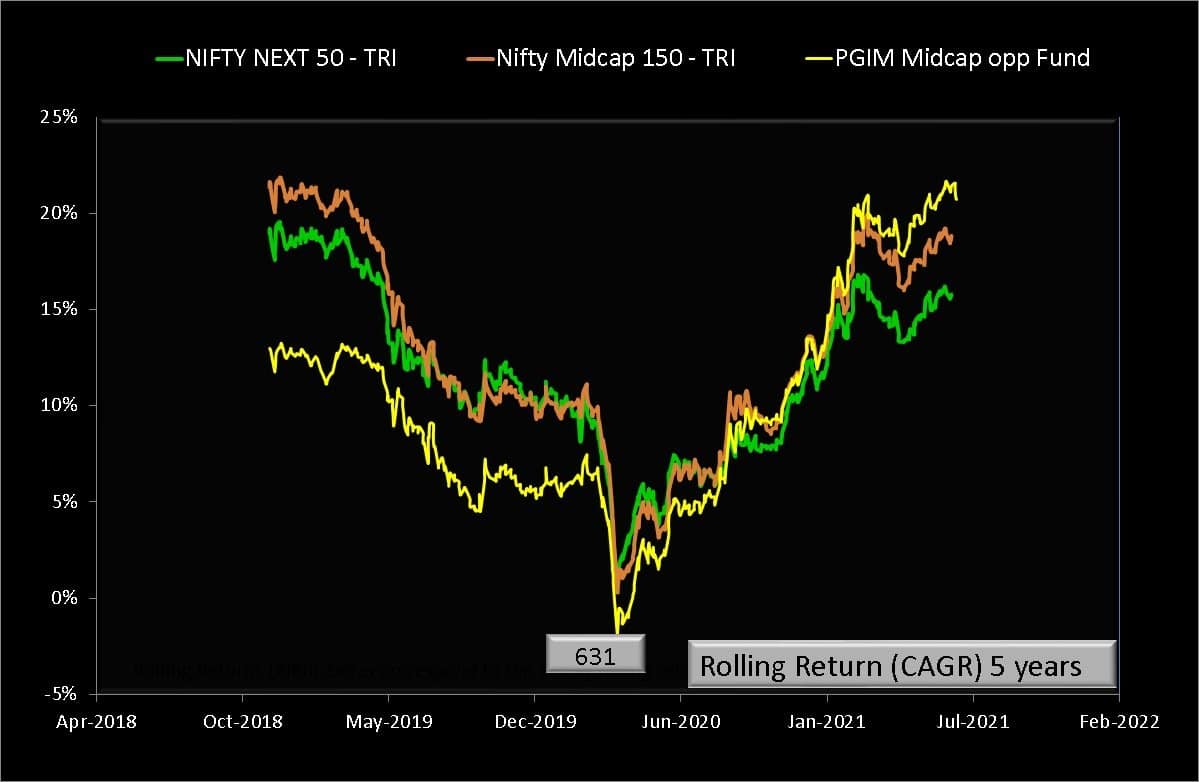
In summary, the popularity of PGIM India Midcap Opportunities Fund stems from investors and rating agencies not looking beyond recent performance. The fund has not proved itself in a bear market, taking on excessive risk by adding small caps. Its entire outperformance has come during a market recovery. At the very least, it has to maintain its performance over the next few years before it can be taken seriously. We recommend that investors not get swayed by its recent performance and avoid it.