Last Updated on August 11, 2025 at 10:20 am
This is a review of PGIM India Global Equity Opportunities Fund. A trailing one year return of 64% (as on Sep 3rd 2020) has been hard to ignore for many readers and I have received several requests for this review.
The first step in evaluating a fund is to check its history. PGIM India Global Equity Opportunities Fund has a long and chequered history. It was started in May 2010 by Deutsche Mutual Fund as DWS Global Agribusiness Offshore Fund that would invest in Luxembourg based DWS Invest Global Agribusiness Fund based.
Pramerica Mutual Fund acquired Deutsche Mutual Fund in Aug 2015. Prior to that, Dewan Housing Finance Corporation Ltd (DHFL) had purchased 50% stake in Pramerical Mutual Fund. From Sep 2015, Pramerica MF became DHFL Pramerica MF. The fund now became DHFL Pramerica Global Agribusiness Offshore Fund.
From Oct 2018, the fund was renamed as DHFL Pramerica Global Equity Opportunities Fund and started to invest in PGIM Jennison Global Equity Opportunities Fund. As is well known, DHFL got into trouble unable to pay dues and had to exit the MF business. Prudential Investment Management (later renamed PGIM) acquired DHFL Pramerica by July 2019.
🔥Secure your future with our Robo-advisory tool trusted by over 3,500 investors and advisors. From effortless retirement planning to funding your children’s biggest dreams, turn your financial goals into reality. 🔥
Subscribe for money management solutions via email! (Link takes you to our email sign-up form) Join 32,000+ readers in our community.
👉 New Tool Alert! NaviPlan: A Privacy-Focused Multi-asset Tracker and Goal Planner 👈
Thus PGIM India Global Equity Opportunities Fund is effectively less than two years old. It is important to fall prey to the classic retail investor mistake – look at a high return from the recent past, get excited, put in money only to see a string of poor returns.
PGIM India Global Equity Opportunities Fund currently has an AUM of 194 Crores with an expense ratio of 1.45% for the regular plan and 0.26% for the direct plan. The direct plan expense is almost half that for Franklin India Feeder – Franklin U.S. Opportunities Fund and possibly Axis Global Equity Alpha Fund of Fund (this is in the NFO stage so expenses are not yet known).
The 0.26% expense is on top of the 0.87% expense for PGIM Jennison Global Equity Opportunities Fund USD I Acc. Part of the reason why PGIM India Global Equity Opportunities Fund delivered stellar returns over the last year should be clear from the below graph.
The since inception NAV movement of PGIM Jennison Global Equity Opportunities Fund USD I Acc (the underlying fund of PGIM India Global Equity Opportunities Fund) compared with S&P 500 Total Return in USD and NASDAQ 100 Total Return in USD is shown below.

Some of the stocks that have driven the NASDAQ 100 up this year are part of the PGIM Jennison fund. As on June 30th 2020, the top holdings are:
1 Amazon.com 7.0%
2 Apple 5.2%
3 Adyen 4.7%
4 Shopify 4.5%
5 Netflix 4.5%
6 Tesla 4.3%
7 MercadoLibre 4.2%
8 Microsoft 4.1%
9 Meituan Dianping 4.0%
10 Mastercard 3.6%
The IT sector weight is 18% higher than its benchmark: MSCI All Country World Index. (as on June 30th 2020, the July 31st weights are available in the Financial Times fund page).
Should you invest in PGIM India Global Equity Opportunities Fund?
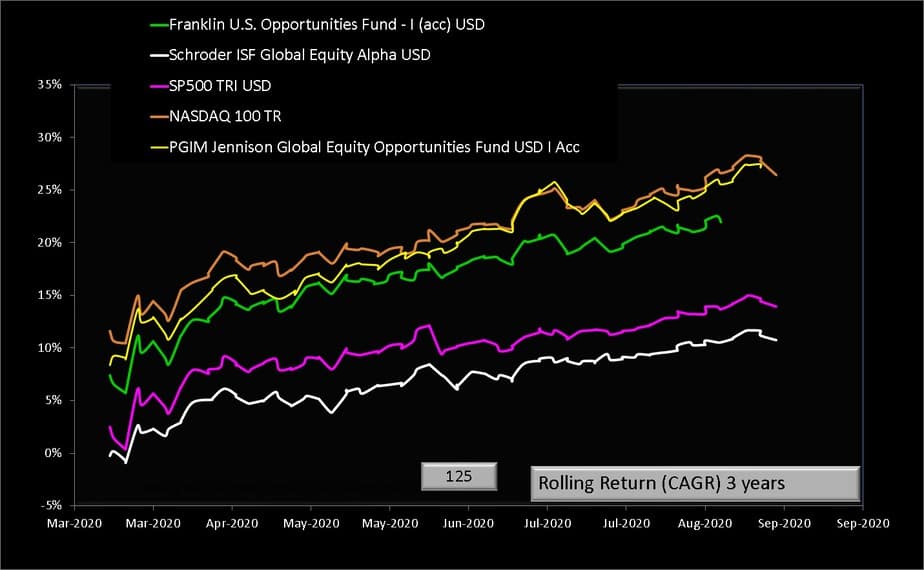
Shown below is the three-year rolling returns of PGIM Jennison Global Equity Opportunities Fund USD I Acc and NASDAQ 100 TR USD and SP500 TRI USD and Franklin U.S. Opportunities Fund – I (acc) USD and Schroder ISF Global Equity Alpha Fund USD.
The Franklin US Feeder fund invests in the Franklin U.S. Opportunities Fund and the new Axis Global Equity Alpha Fund of Fund invests in Schroder ISF Global Equity Alpha Fund. All returns are in USD. There are only 125 data points in each coloured line.
If you want to chase after returns, do not mind concentration risk and huge falls that can result from it, Motilal Oswal NASDAQ 100 Fund of Fund is a relatively better choice compared to PGIM India Global Equity Opportunities Fund.
The Motilal Oswal fund of fund has a total expense of 0.1% plus 0.54% for the underlying N100 ETF. Compared to this the PGIM fund investors will have to pay 0.26% + 0.87% (see above). More importantly, the fund managers call can (like with any active fund) make or break returns.
An investor wanting “US stock exposure” with better diversification among sectors to reduce risk is better off with Motilal Oswal S&P 500 Index Fund. This currently has an expense ratio of only 0.49%. See: Motilal Oswal S&P 500 Index Fund: What return can I expect from this?
Consider the way in which NASDAQ has zoomed up in the last few months, investors are better off with relatively sedate(!) S&P 500, but must also appreciate basic portfolio management techniques to lower overall risk.
Investors must never invest based on recent past performance. It would almost always be a case of “what goes up will come down” and better to invest when “down” and then “up” (again relatively speaking with associated T&C!).