A reader asks, “Which will fetch more returns over 15 years, an SIP or a lump sum investment?” Comparing the returns of a SIP with a lump sum investment has little practical use. After all, none of us will invest just once in the market or always systematically. Even if we did make the comparison, we expect the SIP to win sometimes and a lump sum investment at other times. See: 10 financial lessons from 10 years of blogging.
I nonetheless went ahead with the comparison because I was curious if we could find some insights. In particular, can we determine which market return sequences favour a SIP or a lump sum?
We use Sensex price data from April 1979. The dividends are not included, but they should not affect the results of our analysis much. We shall compare the returns of an SIP and lump sum investment over 15 years that started on the same date. The returns are also computed on the same date. Over this period, the SIP and the lump sum investment will benefit from dividends similarly if invested in an index fund with a growth option.
There are only 361 data points because our stock market history is short. A similar analyst with the S&P 500 would yield close to 1300 data points! See: The Stock market always moves up in the long term, but returns move up and down!
The XIRR of 15-year SIP vs lump sum investment in the Sensex price index is shown below. There are 361 15-year periods (one month apart) from April 1976 to Apr 2024.
🔥Secure your future with our Robo-advisory tool trusted by over 3,500 investors and advisors. From effortless retirement planning to funding your children’s biggest dreams, turn your financial goals into reality. 🔥
Subscribe for money management solutions via email! (Link takes you to our email sign-up form) Join 32,000+ readers in our community.
👉 New Tool Alert! NaviPlan: A Privacy-Focused Multi-asset Tracker and Goal Planner 👈
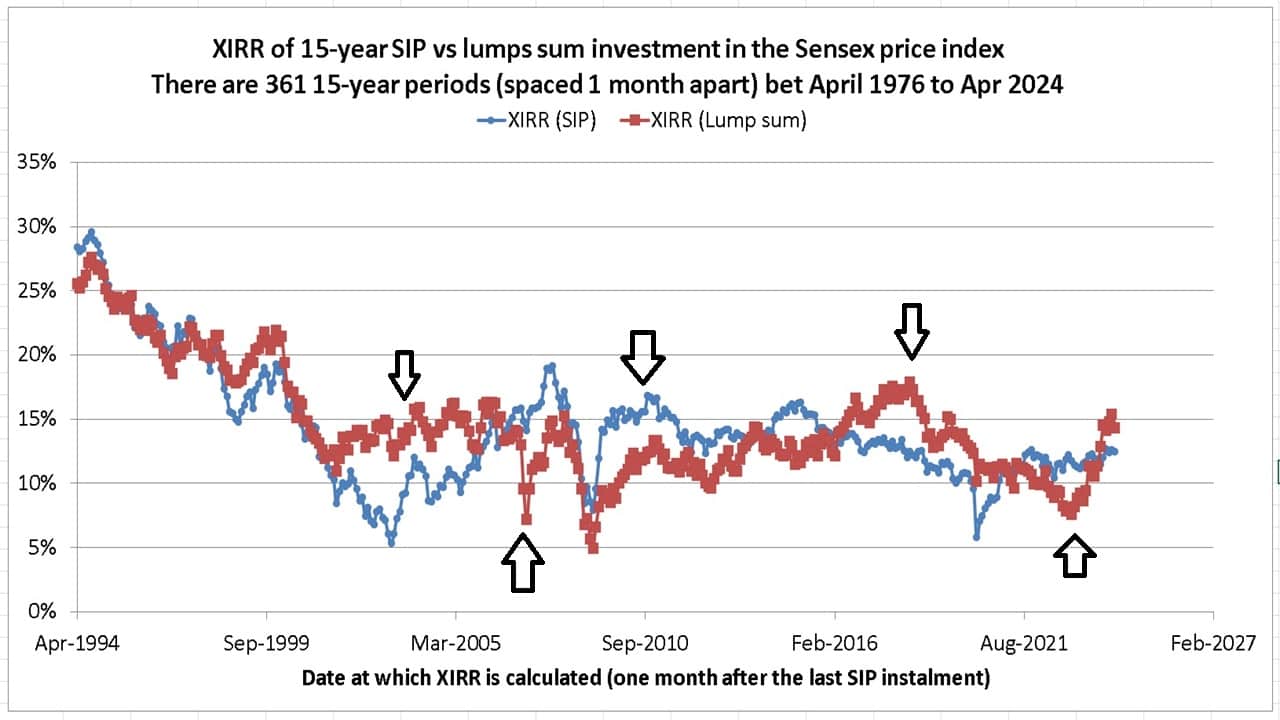
We can see that sometimes SIP “wins” and sometimes a lump sum investment. We have no way of knowing beforehand which will do better (even if we take such a comparison seriously, we should not!).
Some of the more dramatic differences between the two investment routes are marked with arrows in the above picture and tabulated below.
| Start Date | End Data | XIRR (SIP) | XIRR (Lump sum) |
| 01-03-1989 | 01-03-2004 | 11.47% | 15.90% |
| 02-04-1992 | 02-04-2007 | 14.14% | 7.20% |
| 01-02-1996 | 01-02-2011 | 15.08% | 12.68% |
| 02-05-2003 | 02-05-2018 | 12.46% | 17.91% |
| 01-01-2008 | 02-01-2023 | 11.76% | 7.62% |
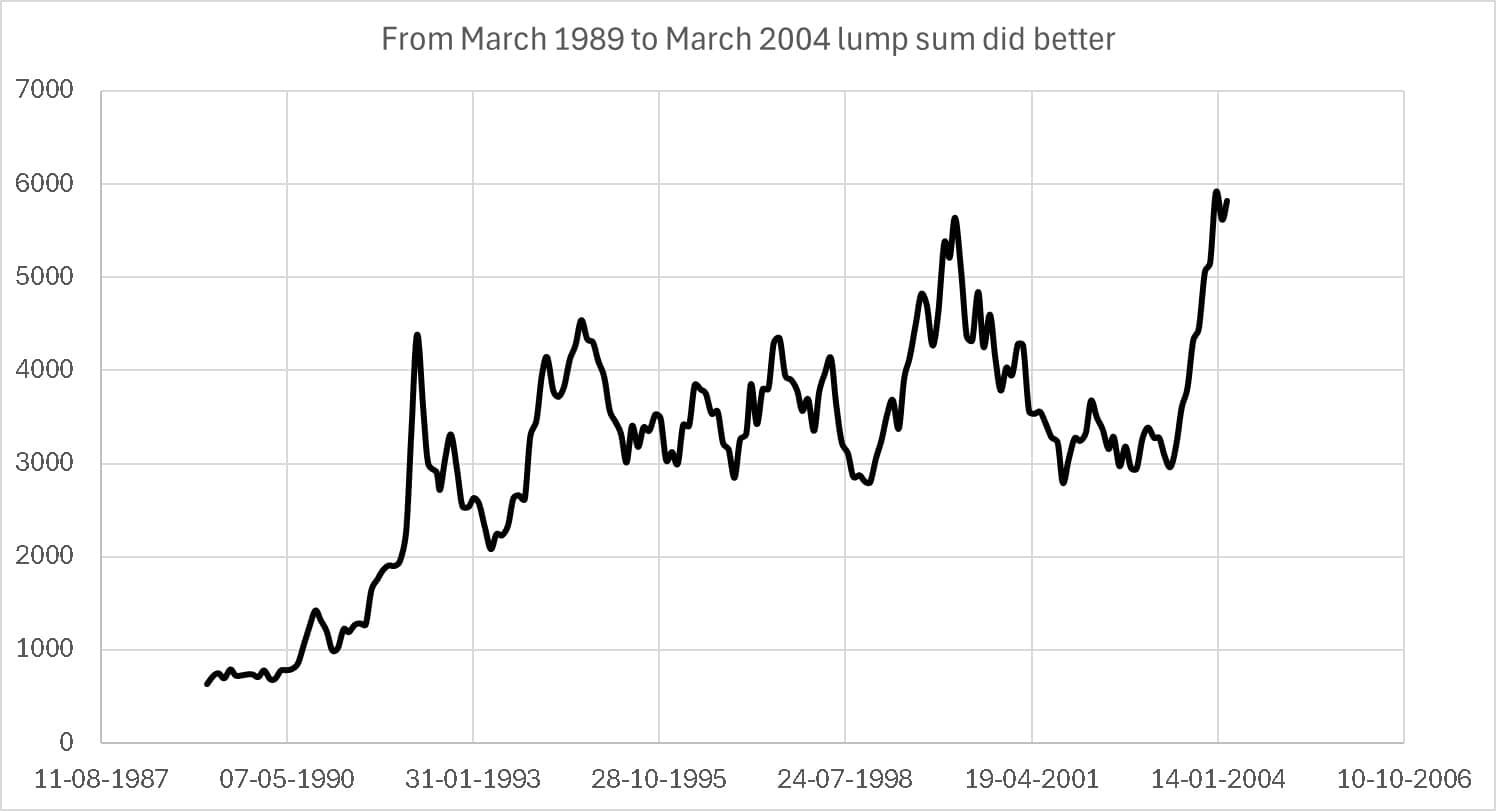
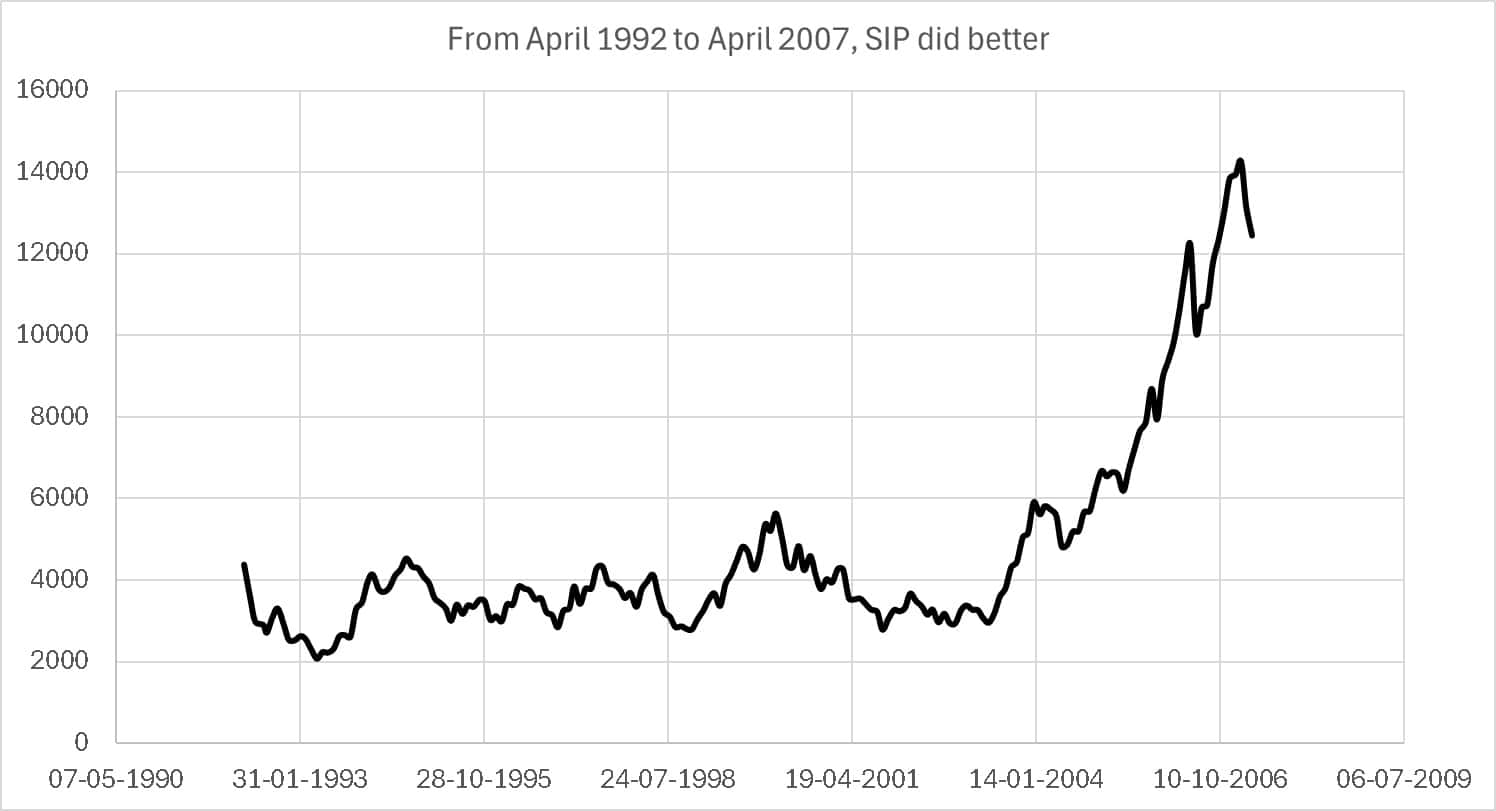
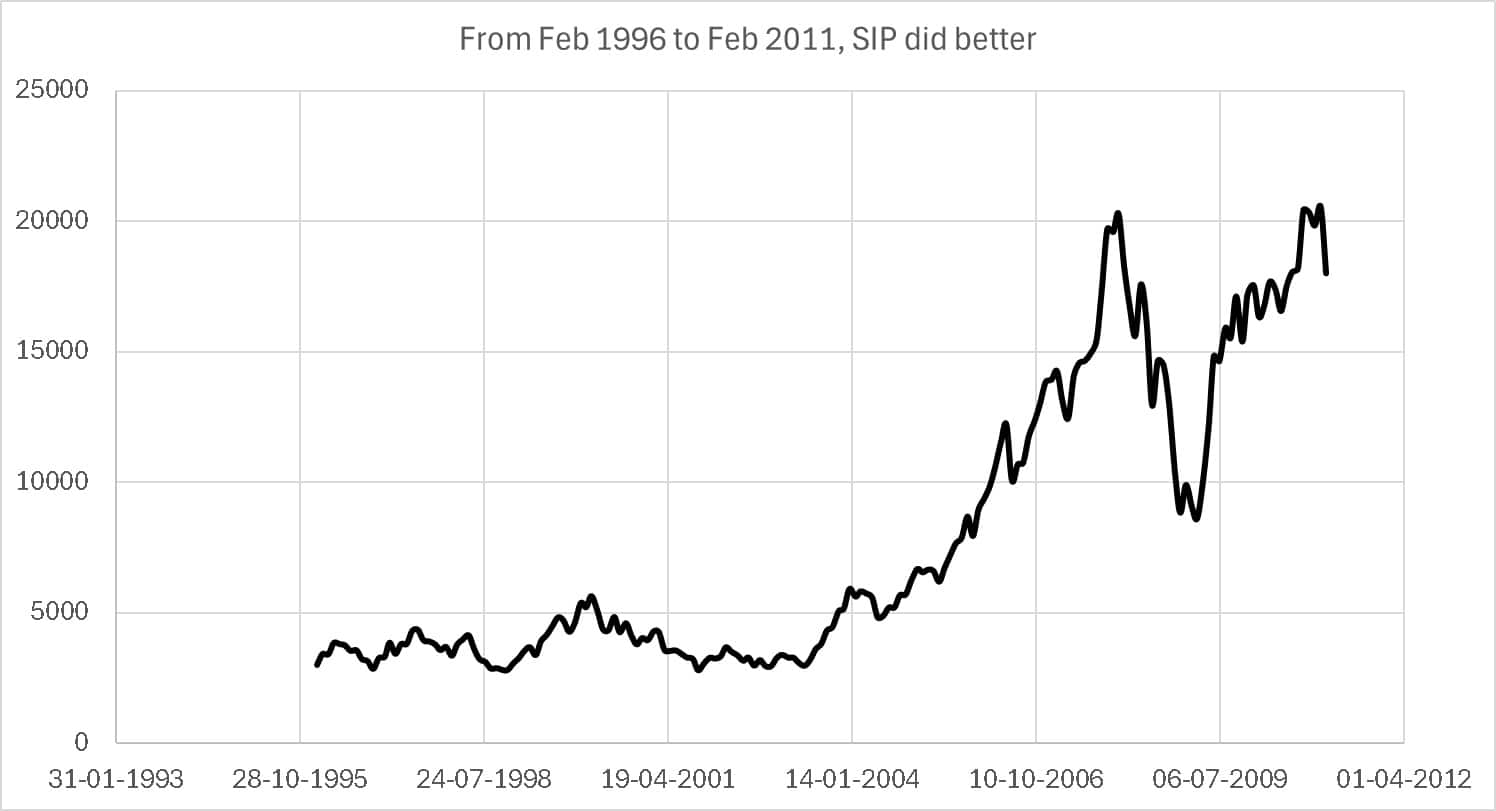
Now, the question is, can we spot a pattern in the return sequences here? Let us look at them one by one.
1 From March 1989 to March 2004, lump sum did better
2 From April 1992 to April 2007, SIP did better
3 From Feb 1996 to Feb 2011, SIP did better
4 From May 2003 to May 2018, lump sum did better

5 From Jan 2008 to Jan 2023, SIP did better
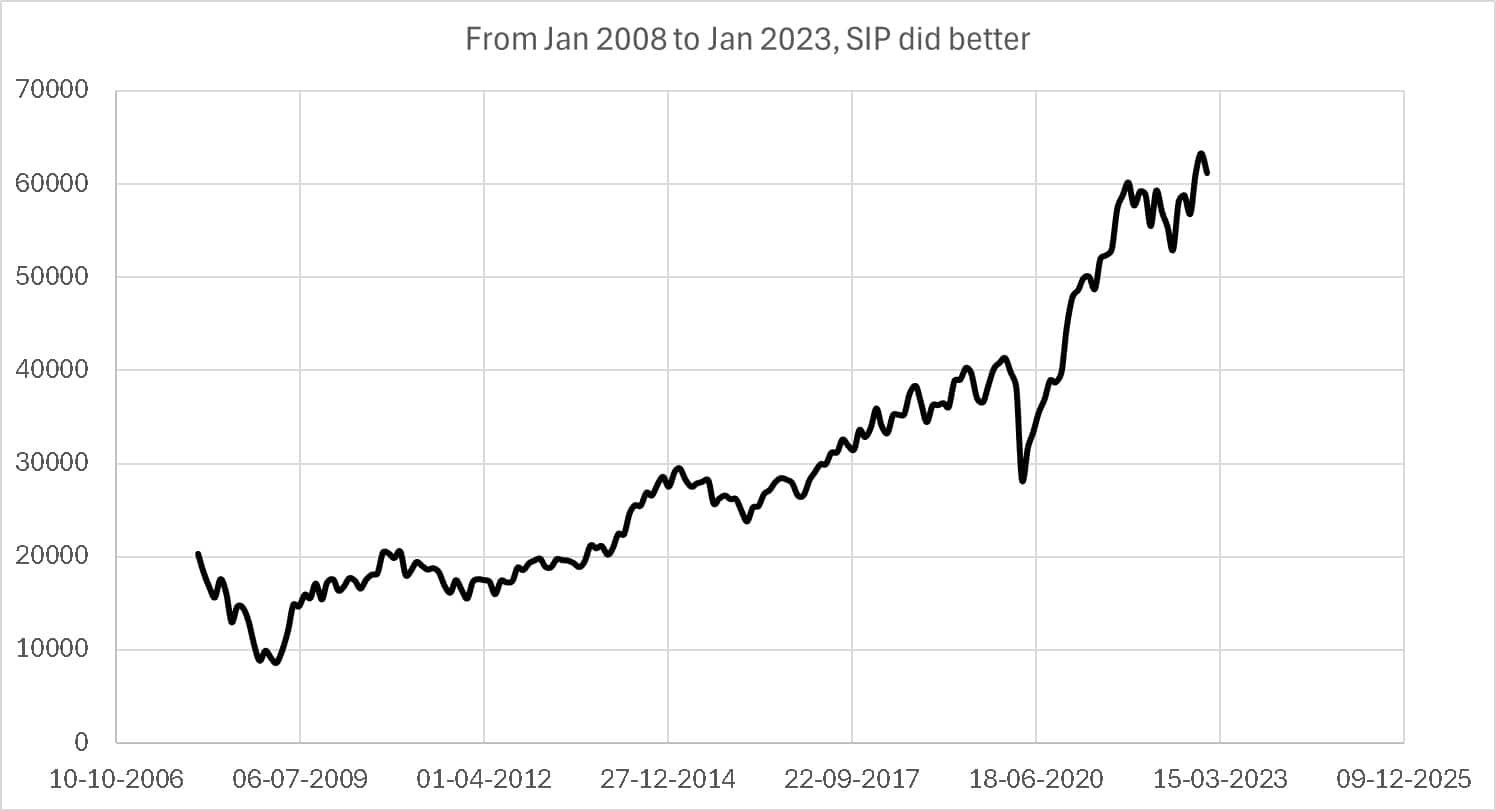
Unfortunately, no set pattern exists to determine which return sequence favours either investment mode. Out of the 361 intervals, the SIP did better 50.4% of the time. So it is a coin toss!
We also looked at the volatility of the portfolio growth (standard deviation) and max fall from a peak (drawdown) but could not spot any meaningful pattern.
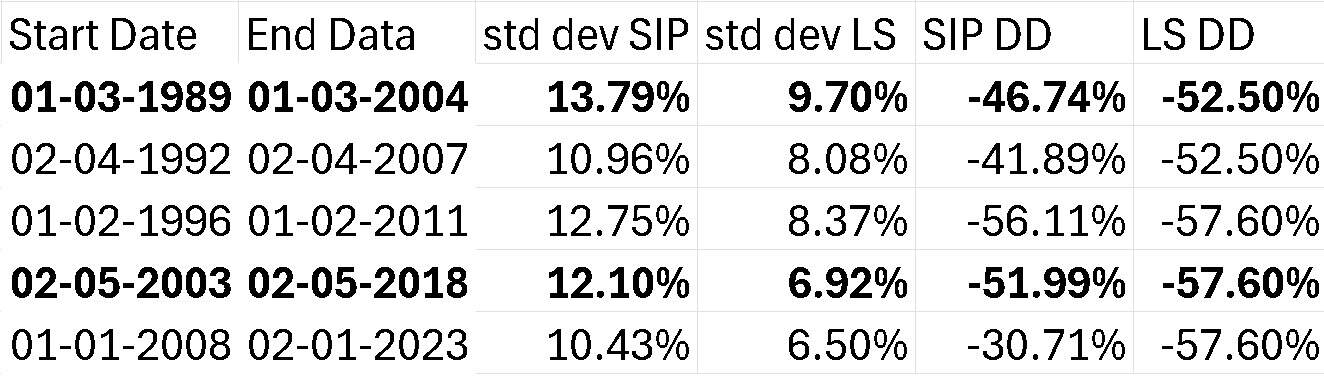
Note: SIP does not reduce investment risk or manage volatility in any way. On the date you choose to calculate returns, your will returns will be up if the market is up. If the market is down, your returns will be down. Myth Busted: SIPs do not reduce risk or enhance returns!
We should stop making these comparisons and invest as soon as we can access the money and as frequently as possible (for long-term goals with the right asset allocation plan).