Last Updated on December 29, 2021 at 6:19 pm
Sunder asks, “We all know that equity returns in the last financial year or last annual year were excellent. Does this mean we should mentally prepare ourselves for poor or even negative returns this year?”
The 97% returns mentioned in the title refer to the NIfty 50 TRI movement from 23rd March 2020 to 23rd March 2021. This is the 19th highest return seen in any one year period from 30th June 1999 (since TRI data is available).
Fourteen out of these 19 returns came between April-May 2003 to April-May 2004 (on different dates). The remaining four returns were seen in late 2009 or early 2010, when the market recovered after the 2008 crisis.
With the full benefit of hindsight, what we have seen from March 2020 to March 2021 or even a bit later is quite special. The question we seek to answer here is, what happened the year after these spectacular returns?
🔥Secure your future with our Robo-advisory tool trusted by over 3,500 investors and advisors. From effortless retirement planning to funding your children’s biggest dreams, turn your financial goals into reality. 🔥
Subscribe for money management solutions via email! (Link takes you to our email sign-up form) Join 32,000+ readers in our community.
👉 New Tool Alert! NaviPlan: A Privacy-Focused Multi-asset Tracker and Goal Planner 👈
Table showing sequence of top 19 two years Nifty 50 TRI returns obtained from rolling returns data.
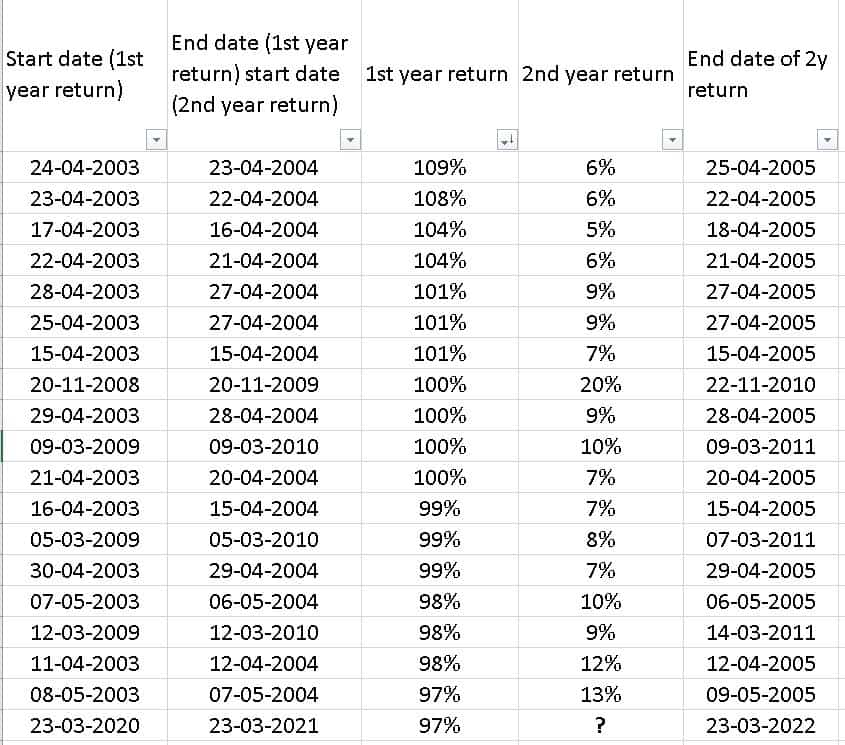
Terms like probability or likelihood should not be used lightly. However, a casual glance at the above table suggests that it would be better for investors to brace for a single-digit FD-like return the year after a spectacular return.
That is just from an emotional point of view. From an analytical standpoint, just about any return is possible. For example, from Jan 13th, 2003 to Jan 13th 2004, 88% of returns were followed by a -1% return. There are 32 instances of the second year producing more than 10% returns when the first-year return was above 90%.
This is a plot of the 2nd year returns (y-axis) versus the 1st-year returns. Only one data set per month is used to reduce clutter.
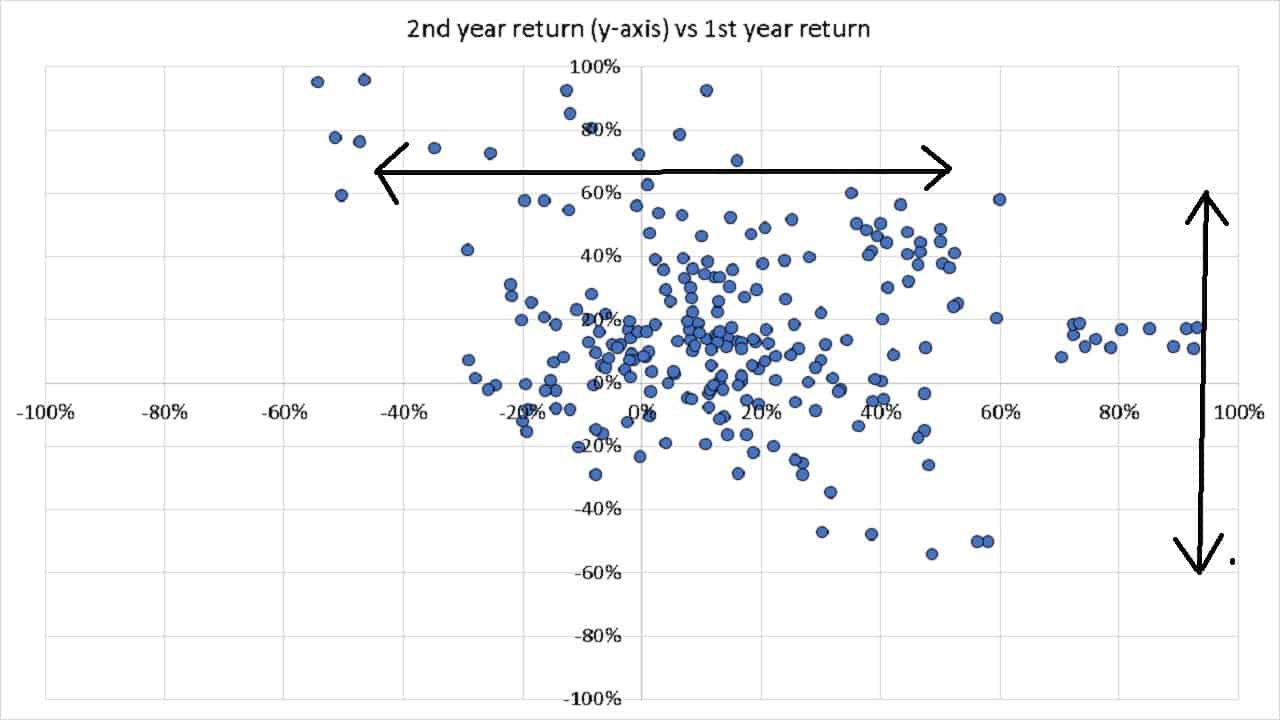
There is a general negative slope to the data. That is a high x-axis value results in a smaller y-axis value and vice-versa. However, the spread as indicated by the two lines is a bit too much for a trend to be established.
For example, consider 1st-year returns of 50-60%. There is a wide range of 2nd year returns possible, as indicated by the vertical arrow. A wide range of 1st-year returns can also lead to a high second-year return, as indicated by the horizontal arrow.
In summary, a high return is typically followed by a relatively lower return (for once intuition matched the data!), but this too is not a guarantee. There is no need for investors to fear this, though. It is just part and parcel of day to day market volatility. Investors should systematically invest for specific goals and should consider such high returns as a rebalancing opportunity if they are already investing as per their desired asset allocation. For example, see Rebalanced my retirement portfolio after 13Y, a crash & recovery!