Last Updated on December 29, 2021 at 5:25 pm
At the time of writing, The Sensex and Nifty fell 10% immediately on opening (13th Mar 2020) and trading has been halted for 45 minutes. The rapid fall in all global markets since late February makes us wonder if we are in the middle of the biggest crash in Indian market history?
This is the sequence of daily Sensex returns from Feb 20th 2020: -0.37%, -1.96%, -0.20%, -0.97%, -0.36%, -3.64%, -0.40%, 1.26%, -0.55%, 0.16%, -2.32%, -5.17%, 0.18%, -8.18%, -9.43% (at 9:50 am 13-3-2020).
To get a perspective of the current fall, we need to look at the history of the Sensex. The price has to be plotted in log scale so that are past bull and bear runs can be set on the same scale.
🔥Secure your future with our Robo-advisory tool trusted by over 3,500 investors and advisors. From effortless retirement planning to funding your children’s biggest dreams, turn your financial goals into reality. 🔥
Subscribe for money management solutions via email! (Link takes you to our email sign-up form) Join 32,000+ readers in our community.
👉 New Tool Alert! NaviPlan: A Privacy-Focused Multi-asset Tracker and Goal Planner 👈
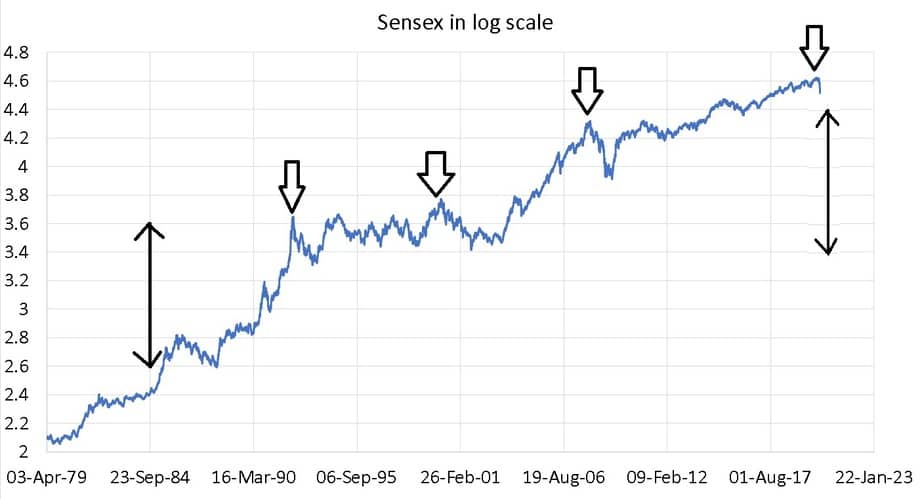
The advantage of the log scale is the size of both double-headed arrows are the same. It can help gauge the extent of up and down movements. If we plot the x-axis also in log scale we can evaluate the time for these as well. Read more: Are you ready to climb the Sensex Staircase?!
The biggest falls in the Sensex are marked by fat down arrows. These represent the Harshad Mehta Scam (April 1992), Dot Com crisis (Deb 2000), 2008 Housing crisis (Jan 2008) and what we shall refer to as the Feb-Mar 2020 fall
Update March 24th 2020: Yesterday was the biggest intraday fall in the market making the current crisis the fast to lose 37%!
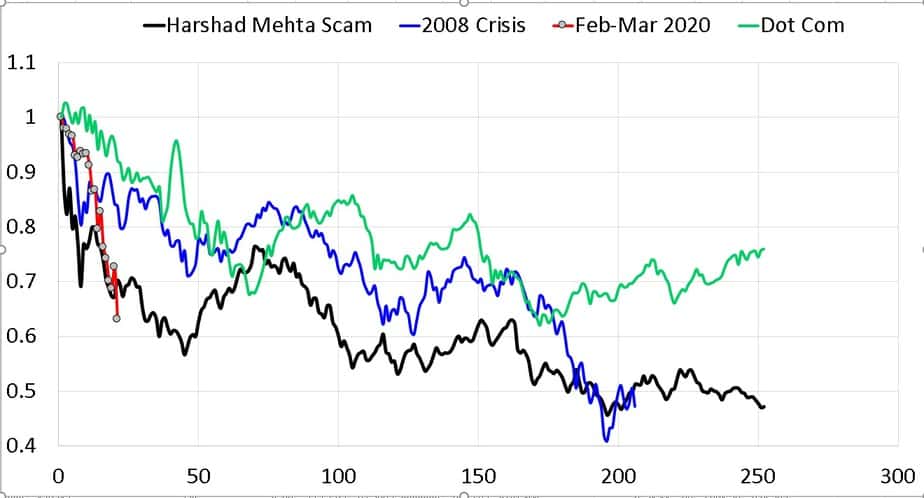
The fall in Sensex indicated in the four time-windows above are plotted together on a normalized scale (price =1 initially). Notice that the current indicated in red is the fastest drop we have seen so far. We are currently in the middle of the biggest market crash.
The arrow represents the price on Mar 13th 2020 9:45 am. As on 10:33 am, the intraday loss is only -2.65% (from -10% plus) but the central conclusions of this article are still valid. The only caveat is, the recovery could be in a few days or weeks or years. We do not know. The best part is we do not need to know!
While the Sensex lost half and more than half of its value in previous crashes, we are close -30% now. No one can predict what would happen going forward.
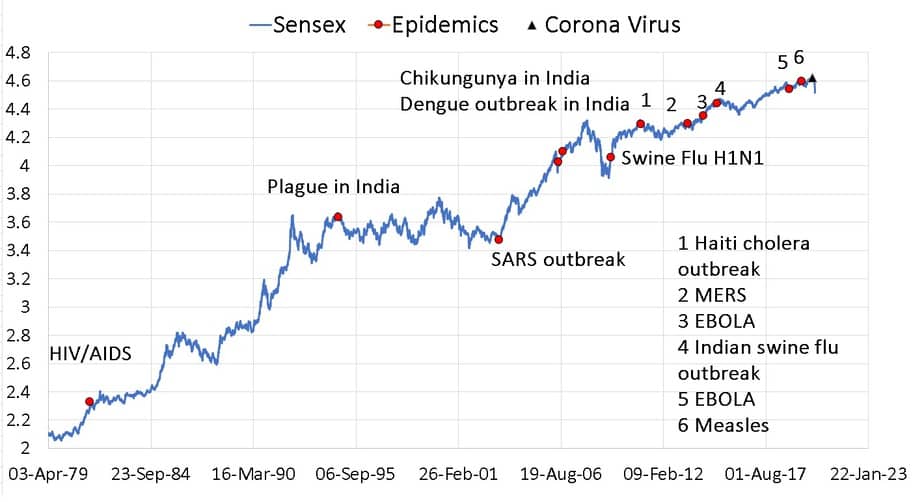
Is this the first-time concerns over an illness is responsible for the fall in Sensex? Quite possible yes as this picture would suggest.
Interesting days ahead. Time to understand why we say Mutual funds have no compounding benefit, appreciate risk and learn how to reduce portfolio risk.