Last Updated on December 29, 2021 at 5:17 pm
We study how IPOs have fared in 2019 via the BSE IPO index which moved up 42.6% in 2019 (does not include listing gains). A look which stocks contributed to the move and associated risks.
What is S&P BSE IPO? The BSE IPO Index measures the performance of BSE listed companies for one year after the completion of their initial public offering (IPO)
How the BSE IPO index is constructed: Stocks will have to be listed at the BSE and should have a minimum float-adjusted market capitalization of INR 1 billion (10 Crores) on the first day of listing.
🔥Secure your future with our Robo-advisory tool trusted by over 3,000 investors and advisors. From effortless retirement planning to funding your children’s biggest dreams, turn your financial goals into reality. 🔥
Subscribe for money management solutions via email! (Link takes you to our email sign-up form) Join 32,000+ readers in our community.
👉 New Tool Alert! NaviPlan: A Privacy-Focused Multi-asset Tracker and Goal Planner 👈
Eligible companies will be included on the third day of their listing and excluded “at the open of the Monday following the third Friday of the month after the completion of one year of listing”. Source: BSE index methodology document
There will be a minimum of ten stocks in the index and in the absence of new IPOs, the exclusions of stocks will be delayed. The index is free-float market cap weighted subject to a cap of 20%.
Current constituents (Nov 30th 2019)
The stocks are arranged by decreasing weight but the actual weights are not available!
| Chalet Hotels Ltd |
| Metropolis Healthcare Ltd |
| Indian Railway Catering and Tourism Corporation Ltd |
| Polycab India Ltd |
| Spandana Sphoorty Financial Ltd |
| Indiamart Intermesh Limited |
| Rail Vikas Nigam Ltd |
| Sterling and Wilson Solar Ltd |
| Affle (India) Ltd |
| MSTC Ltd |
List of 2019 IPOs with Listing gains and current gains
There were 48 IPOs in 2019. The follow table lists these in order of decreasing current gains. The listing gains are also shown (this is not relevant to BSE IPO Index).
Listing Gain = (listing price – offer price)/offer price
Current Gain = (Current price – listing price)/Listing price.
Current price = closing price as on 27th Dec. 2019.
Data for this table has been sourced from Economic Times
| IPO Name | Listing gain | Current gain |
| Evans Electric Ltd. | 0% | 235% |
| V R Films & Studios Ltd. | 2% | 134% |
| Parshva Enterprises Ltd. | 2% | 113% |
| Artemis Electricals Ltd. | 17% | 106% |
| Goblin India Ltd. | 6% | 83% |
| Misquita Engineering Ltd. | 3% | 83% |
| IndiaMART InterMESH Ltd. | 21% | 76% |
| Affle (India) Ltd. | 25% | 71% |
| Polycab India Ltd. | 18% | 54% |
| Axita Cotton Ltd. | 2% | 51% |
| Metropolis Healthcare Ltd. | 9% | 48% |
| Spandana Sphoorty Financial Ltd. | -4% | 46% |
| Vishwaraj Sugar Industries Ltd. | 2% | 45% |
| SBC Exports Ltd. | 0% | 43% |
| Neogen Chemicals Ltd. | 17% | 41% |
| Indian Railway Catering & Tourism Corporation Ltd. | 101% | 37% |
| Anand Rayons Ltd. | 5% | 35% |
| MSTC Ltd. | -8% | 32% |
| White Organic Retail Ltd. | 2% | 28% |
| Earum Pharmaceuticals Ltd. | 0% | 24% |
| Rail Vikas Nigam Ltd. | 0% | 21% |
| Chalet Hotels Ltd. | 4% | 16% |
| Xelpmoc Design and Tech Ltd. | -15% | 13% |
| Roopshri Resorts Ltd. | 1% | 10% |
| Aartech Solonics Ltd. | 0% | 7% |
| Galactico Corporate Services Ltd. | 1% | 6% |
| SK International Export Ltd. | -4% | 4% |
| Alphalogic Techsys Ltd. | -1% | 2% |
| Humming Bird Education Ltd. | 0% | 2% |
| Transpact Enterprises Ltd. | 2% | 0% |
| Gensol Engineering Ltd. | 3% | -3% |
| Anuroop Packaging Ltd. | 2% | -5% |
| GKP Printing & Packaging Ltd. | 7% | -6% |
| Anmol India Ltd. | 2% | -7% |
| Ujjivan Small Finance Bank Ltd. | 57% | -7% |
| Novateor Research Laboratories Ltd. | 0% | -10% |
| CSB Bank Ltd. | 41% | -16% |
| City Pulse Multiplex Ltd. | -5% | -21% |
| Ritco Logistics Ltd. | 6% | -23% |
| Ashapuri Gold Ornament Ltd. | -2% | -31% |
| Kranti Industries Ltd. | -5% | -34% |
| Mahip Industries Ltd. | 0% | -38% |
| Northern Spirits Ltd. | 2% | -45% |
| KPI Global Infrastructure Ltd. | 1% | -51% |
| Sterling and Wilson Solar Ltd. | -10% | -56% |
| Jinaams Dress Ltd. | 0% | -64% |
| Cian Healthcare Ltd. | -5% | -73% |
| Suich Industries Ltd. | -9% | -76% |
Out of the 48 IPOs in 2019, 29 of them have moved up after listed and 15/29 move up more than 40%! Four stocks moved up by more than 100%. All these have contributed in various proportions to the 42.6% gain in 2019.
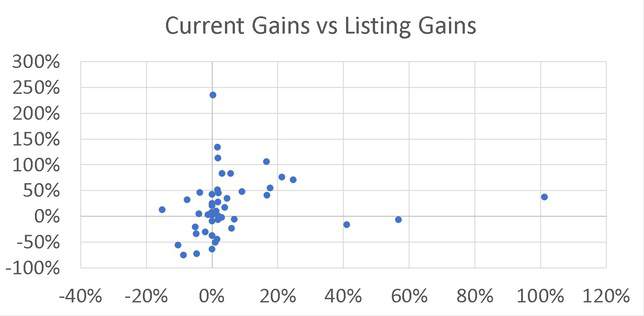
Current Gains vs Listing Gains
The current gains (vertical axis) are plotted against their listing gains. Stocks that moved up dramatically on listing have not gained as much since then which is to be expected (this is not mean reversion). Six stocks that listed at a discount to the offer price, fell further!
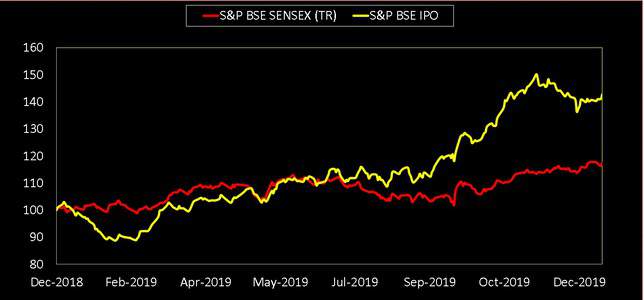
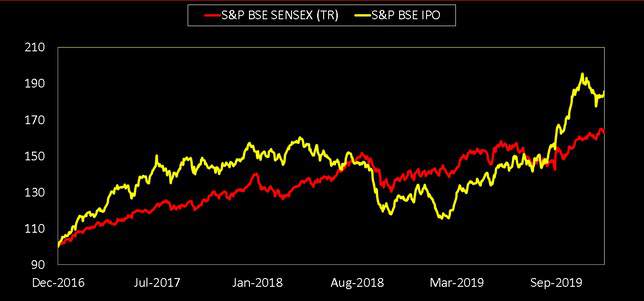
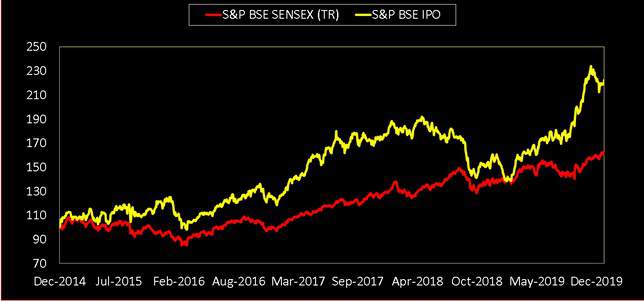
BSE IPO Index vs BSE Sensex
In order to understand the associated risk let us compare the BSE IPO Index with the Sensex over different durations.
1 year
Most of the gains for BSE IPO Index has come in the last quarter.
3 years
5 years
10 years
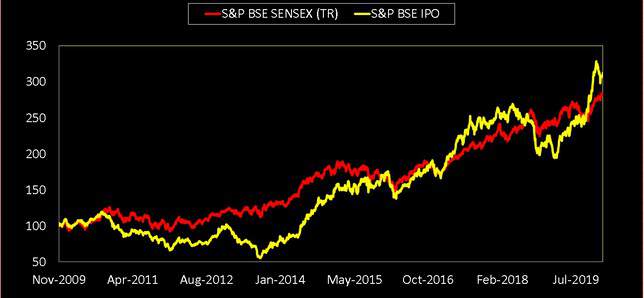
Clearly the BSE IPO is far more volatile than the Sensex with a bad phase erasing gains obtained over several years.
Summary
The year 2019 has been a fantastic year for IPOs with many registering stellar gains on listing. Some also moved up later resulting in a last quarter surge of the BSE IPO index. While there are no index funds or ETFs to track IPOs, the movement of the BSE index carries a simple, intutive lesson: IPOs tend to fare better during bull markets although chasing after IPO gains can be risky bussiness on any given day.

Join 32,000+ readers and get free money management solutions delivered to your inbox! Subscribe to get posts via email! (Link takes you to our email sign-up form)
🔥You can also avail massive discounts on our courses and the freefincal investor circle! 🔥& join our community of 8000+ users!
Track your mutual funds and stock investments with this Google Sheet!
We also publish monthly equity mutual funds, debt and hybrid mutual funds, index funds, and ETF screeners, as well as momentum and low-volatility stock screeners.
You can follow our articles on Google News

We have over 1,000 videos on YouTube!

Join our WhatsApp Channel


- Do you have a comment about the above article? Reach out to us on Twitter: @freefincal or @pattufreefincal
- Have a question? Subscribe to our newsletter using the form below.
- Hit 'reply' to any email from us! We do not offer personalised investment advice. We can write a detailed article without mentioning your name if you have a generic question.
Join 32,000+ readers and get free money management solutions delivered to your inbox! Subscribe to get posts via email! (Link takes you to our email sign-up form)
About The Author
Dr M. Pattabiraman (PhD) is the founder, managing editor and primary author of freefincal. He is an associate professor at the Indian Institute of Technology, Madras. He has over 14 years of experience publishing news analysis, research and financial product development. Connect with him via Twitter(X), LinkedIn, or YouTube. Pattabiraman has co-authored three print books: (1) You can be rich too with goal-based investing (CNBC TV18) for DIY investors. (2) Gamechanger for young earners. (3) Chinchu Gets a Superpower! for kids. He has also written seven other free e-books on various money management topics. He is a patron and co-founder of “Fee-only India,” an organisation promoting unbiased, commission-free, AUM-independent investment advice.
Our flagship course! Learn to manage your portfolio like a pro to achieve your goals regardless of market conditions! ⇐ More than 3,500 investors and advisors are part of our exclusive community! Get clarity on how to plan for your goals and achieve the necessary corpus no matter the market condition!! Watch the first lecture for free! One-time payment! No recurring fees! Life-long access to videos! Reduce fear, uncertainty and doubt while investing! Learn how to plan for your goals before and after retirement with confidence.
Increase your income by getting people to pay for your skills! ⇐ More than 800 salaried employees, entrepreneurs and financial advisors are part of our exclusive community! Learn how to get people to pay for your skills! Whether you are a professional or small business owner seeking more clients through online visibility, or a salaried individual looking for a side income or passive income, we will show you how to achieve this by showcasing your skills and building a community that trusts and pays you. (watch 1st lecture for free). One-time payment! No recurring fees! Life-long access to videos!
Our book for kids: “Chinchu Gets a Superpower!” is now available!


Must-read book even for adults! This is something that every parent should teach their kids right from their young age. The importance of money management and decision making based on their wants and needs. Very nicely written in simple terms. - Arun.Buy the book: Chinchu gets a superpower for your child!
How to profit from content writing: Our new ebook is for those interested in getting a side income via content writing. It is available at a 50% discount for Rs. 500 only!
Do you want to check if the market is overvalued or undervalued? Use our market valuation tool (it will work with any index!), or get the Tactical Buy/Sell timing tool!
We publish monthly mutual fund screeners and momentum, low-volatility stock screeners.
About freefincal & its content policy. Freefincal is a News Media organisation dedicated to providing original analysis, reports, reviews and insights on mutual funds, stocks, investing, retirement and personal finance developments. We do so without conflict of interest and bias. Follow us on Google News. Freefincal serves more than three million readers a year (5 million page views) with articles based only on factual information and detailed analysis by its authors. All statements made will be verified with credible and knowledgeable sources before publication. Freefincal does not publish paid articles, promotions, PR, satire or opinions without data. All opinions will be inferences backed by verifiable, reproducible evidence/data. Contact Information: To get in touch, please use our contact form. (Sponsored posts or paid collaborations will not be entertained.)
Connect with us on social media
- Twitter @freefincal
- Subscribe to our YouTube Videos
- Posts feed via Feedburner.
Our publications
You Can Be Rich Too with Goal-Based Investing
 Published by CNBC TV18, this book is designed to help you ask the right questions and find the correct answers. Additionally, it comes with nine online calculators, allowing you to create custom solutions tailored to your lifestyle. Get it now.
Gamechanger: Forget Startups, Join Corporate & Still Live the Rich Life You Want
 This book is designed for young earners to get their basics right from the start! It will also help you travel to exotic places at a low cost! Get it or gift it to a young earner.
Your Ultimate Guide to Travel
 This is an in-depth exploration of vacation planning, including finding affordable flights, budget accommodations, and practical travel tips. It also examines the benefits of travelling slowly, both financially and psychologically, with links to relevant web pages and guidance at every step. Get the PDF for Rs 300 (instant download)