Last Updated on August 22, 2022 at 11:14 pm
Readers may be aware of the recent studies in which we identified only three midcap funds and only three small cap funds managed to beat the Nifty Next 50 consistently in the last few years. While this is a clear case of investing in the Nifty Next 50 index funds, readers must be aware of the associated risks.
One does not need to look far to appreciate this risk. The last 3Y return of ICICI Nifty Next 50 index fund is 0.02% (-0.38% for geniuses who use regular plans for index funds). The last 5Y return is 6.4%. The last 10Y return of Nippon India ETF Junior BeES is 9.3% (using ETF price).
This alone should justify the title of the post, but only for those who are not in denial -” stop calculating returns after a crash, it would obviously be lower!” Maybe an analyst working for an AMC can pick and choose when to calculate returns, but real life is quite different.
🔥Secure your future with our Robo-advisory tool trusted by over 3,500 investors and advisors. From effortless retirement planning to funding your children’s biggest dreams, turn your financial goals into reality. 🔥
Subscribe for money management solutions via email! (Link takes you to our email sign-up form) Join 32,000+ readers in our community.
👉 New Tool Alert! NaviPlan: A Privacy-Focused Multi-asset Tracker and Goal Planner 👈
Here are some facts about the Nifty Next 50. The index has a base date of November 4th 1996 (price = 1000) and an inception date of December 24th 1996. Source: Factsheet. However, the total returns index data is available only from 08-11-2002.
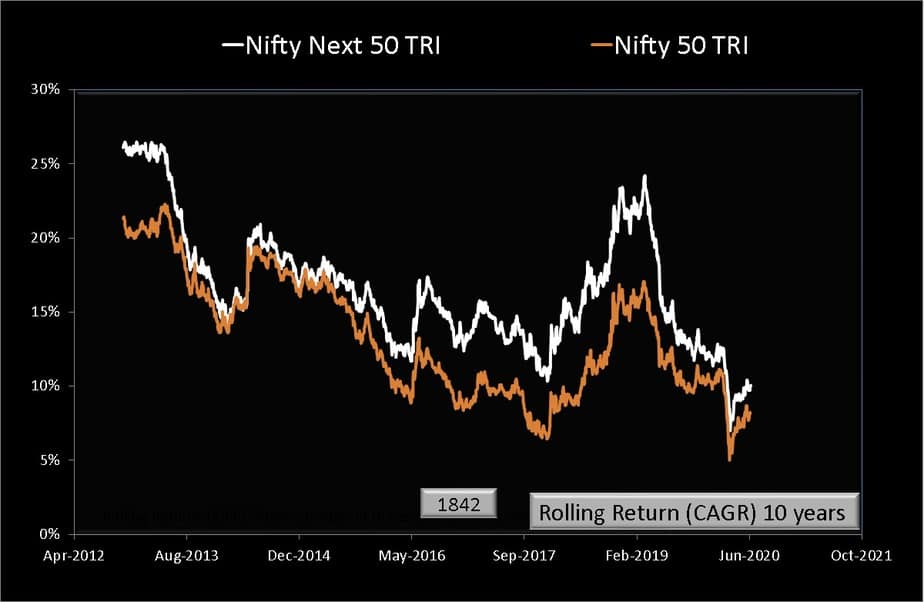
On November 25th 2008, after the global financial crisis, the index fell to 332, equivalent to -12% annualised return after 12 years. On March 23rd 2020, the 10-year NN50 TRI returns dropped to 7%. This is the second time in about nine years that the return has dropped below 10%.
Just how volatile the Nifty Next 50 can be, is evident from this normalised comparison of Nifty 50 and Nifty Next 50 total return indices from November 8th 2002. What moves up, also falls more.
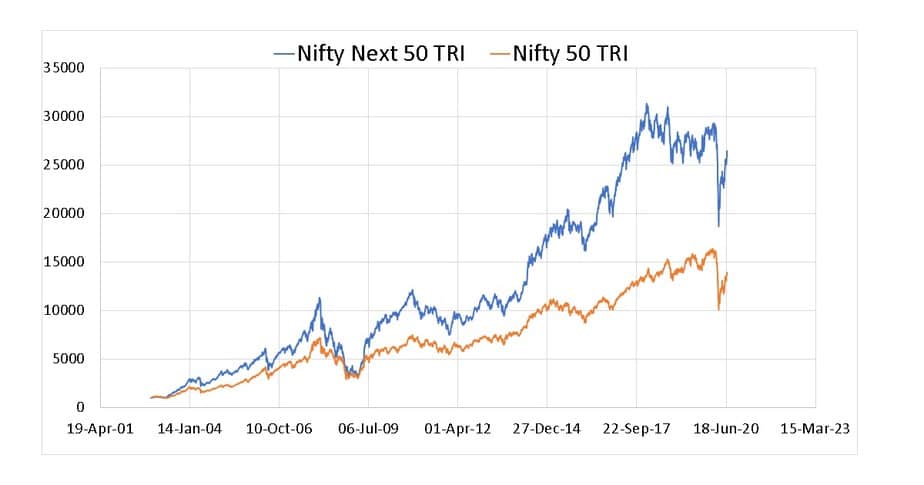
The ten-year rolling return history of Nifty 50 and NIfty Next 50 shows a similar trend. See: 15-year Nifty SIP returns crash to 8% (51% reduction since 2014). Not have both fallen over time, the gap between Nifty Next 50 and Nifty 50 periodically drops to zero.
What does all this mean for an investor? Do not rush to conclude that actively managed funds are better. They are not. When you add NN50 into a portfolio, you increase its risk for sure all the time. You will not get a commensurate reward all the time.
So do not invest in Nifty Next 50 expecting double-digit returns. The additional risk from NN50 must be periodically rebalanced with both Nifty and debt. You can do this either systematically or tactically. We shall discuss these aspects in future articles.