Last Updated on December 18, 2021 at 10:37 pm
Have you ever wondered how the total expense ratio (TER) of a mutual fund is calculated? Or what the constituents of the TER are? The most authentic publically available source for understanding the TER is the annual report released by AMC.
Yesterday, Franklin Templeton announced to its investors that the abridged annual report for 2015-2016 was available for download. While some AMCs release category-wise annual reports, Franklin has a separate file for each fund.
So I got hold of the report for Franklin India Smaller Companies Fund. This fund has always shown a significant difference between direct plan and regular plan returns. For example see: Returns Comparison 2016: Direct Mutual Fund vs. Regular Mutual Fund or the one made in 2015: Direct Mutual Fund Option: The Second Anniversary Report.
The following images are adapted from the annual report of the fund (page 5).
🔥Secure your future with our Robo-advisory tool trusted by over 3,500 investors and advisors. From effortless retirement planning to funding your children’s biggest dreams, turn your financial goals into reality. 🔥
Subscribe for money management solutions via email! (Link takes you to our email sign-up form) Join 32,000+ readers in our community.
👉 New Tool Alert! NaviPlan: A Privacy-Focused Multi-asset Tracker and Goal Planner 👈
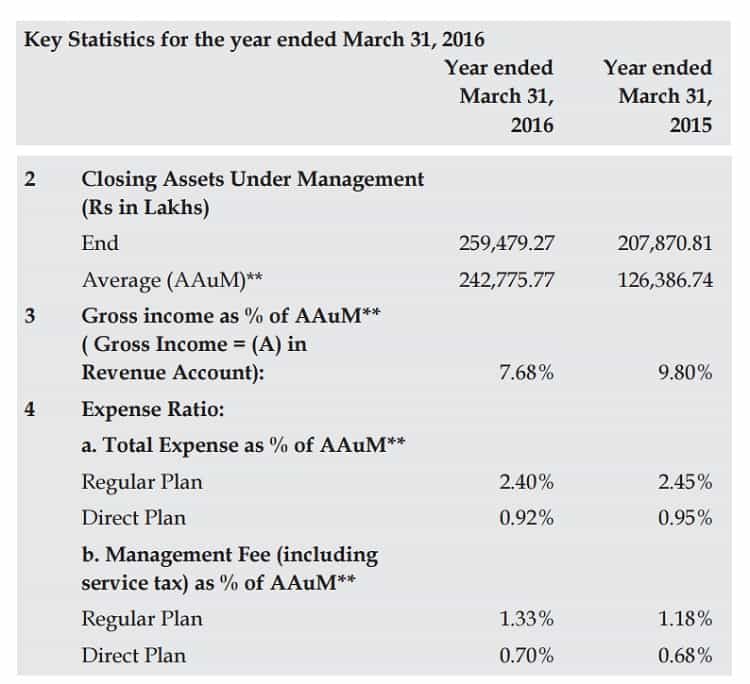
Usually, AAuM refers to the (monthly) average assets under management. It is however not clear what the average here is. The AAuM mentioned in (2) above is the regular plan + direct plan AuM in both dividend and growth plans.
However, the AAuM mentioned in (4 a,b) is the total AUM in either regular plan or direct plan.
The constituents of the total expense ratio are given below. This is for regular and direct combined.
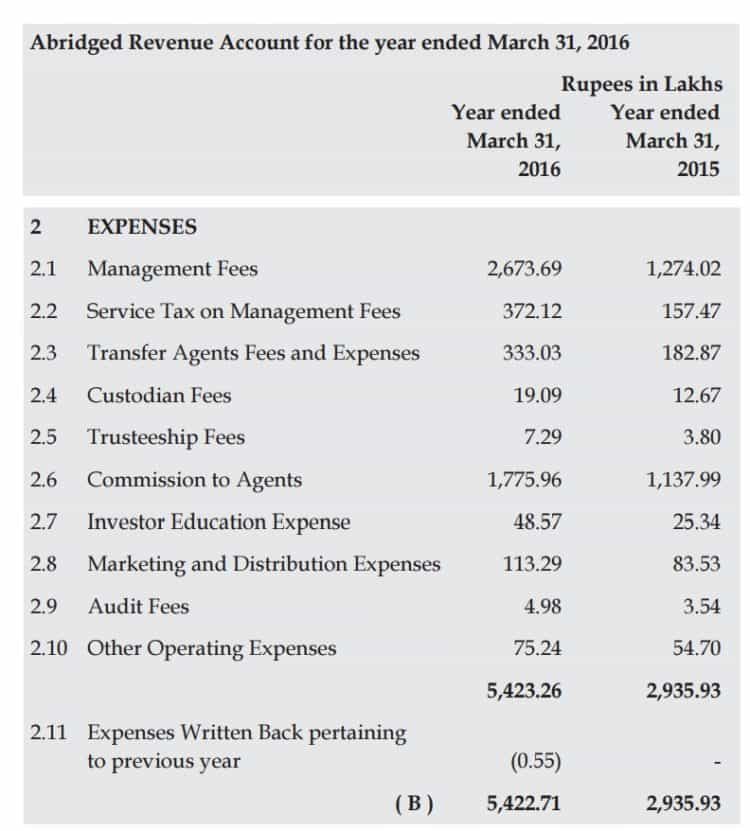
Item 2.6 – commissions should be absent in the direct plan.
The regular plan expense ratio of 2.40% matches with the March 2016 fund factsheet. For the direct plan, the fact sheet says it is 1.28% as against 0.92% in the annual report. There are also discrepancies between closing AAuM in the report and that found at AMFI and the factsheet. For now, I will put this down to my own lack of understanding of the manner of reporting.
I have used the monthly AAuM reported at AMFI to understand the breakup of the total expense ratio.
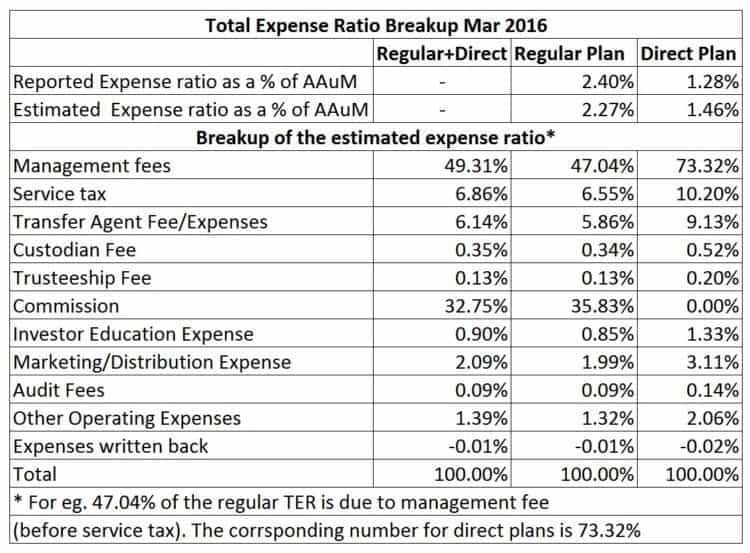
There is a discrepancy as expected between the reported and calculated values of the TER. This is due to the difference in AUM or the way in which they are reported. There is nothing alarming about it and I do not wish to read too much into an approximate estimate.
The idea behind this post is to understand what the constituents of the TER are and their weights. Notice how the management fee is much higher in the case of direct plan due to the lack of commissions.
I wish I could get my hands on a set of data that can be consistently accounted for. Guess that will have to wait for now.
In other news: Check out the four free freefincal ebooks and the site map for navigating all parts of the blog.