Last Updated on December 29, 2021 at 6:05 pm
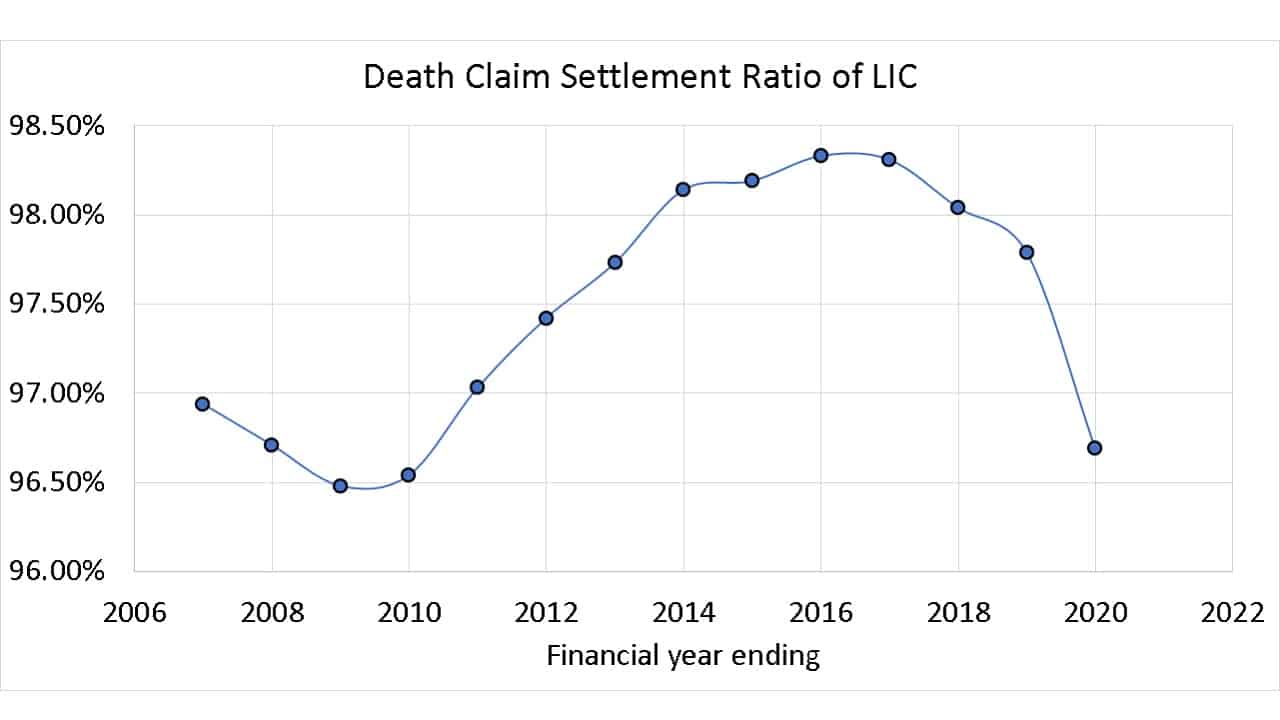
In the recently released IRDA annual report for FY 2019-2020, LIC’s claim settlement ratio (CSR, death claims) was 96.69%. Since FY 2016-2017, LIC’s CSR has been decreasing. Is this a cause for concern? We investigate.
Before we proceed, the reader needs to appreciate that the Claim settlement ratio is not a probability of life insurance claim acceptance! Studying the CSR history of LIC can give insights into how the corporation has reacted to an increase in the number of claims. The results of this study have little bearing on individual claims.
The latest CSR data is available here: IRDA Life Insurance Claim Settlement Ratio Data for 2021. LIC’s CSR reduced from 98.33% in 2015-16 to 96.69% in FY 2019-2020. From the undisputed leader in CSR, the corporation has dropped several places down.
LIC’s claim settlement ratio history
| Financial year ending | CSR | Total Claims |
| 2020 | ||
To understand what is happening, we must appreciate the scale of operations of LIC. Even in 2019-2020, the total number of claims received and the total number of claims paid by LIC is about 6.5 times the corresponding numbers of the entire private life insurance sector.
🔥Secure your future with our Robo-advisory tool trusted by over 3,500 investors and advisors. From effortless retirement planning to funding your children’s biggest dreams, turn your financial goals into reality. 🔥
Subscribe for money management solutions via email! (Link takes you to our email sign-up form) Join 32,000+ readers in our community.
👉 New Tool Alert! NaviPlan: A Privacy-Focused Multi-asset Tracker and Goal Planner 👈
The highest CSR in the above data set is 98.33% in FY 2015-16. The lowest is 96.48% in FY 2008-09. If LIC’s CSR in FY 2015-16 were 96.48%, it would mean a rejection of 14,088 extra claims – a mere 1.85% of the total claims received. Even in FY 2019-20, only two private players have total claims received or paid more than 14K claims!
IN FY 2019-2020, the number of claims received is 3067 less than what was received in FY 2015-16 (which has the highest CSR in the above data set). However, claims paid out in FY 2019-20 was 15440 less than FY 2015-16.
Since 2011, LIC has received more than 7 lakh death claims each financial year. If we normalize the total claims and claims paid for FY 2006-07 (an arbitrary choice), we get the following table.
| Financial year ending | Total Claims in each FY divided by total claims in FY 2006-07 | Claims paid in each FY divided by claims paid in FY 2006-07 |
| 2020 | 1.24 | 1.24 |
| 2019 | 1.23 | 1.24 |
| 2018 | 1.21 | 1.22 |
| 2017 | 1.26 | 1.28 |
| 2016 | 1.25 | 1.26 |
| 2015 | 1.24 | 1.25 |
| 2014 | 1.24 | 1.26 |
| 2013 | 1.23 | 1.24 |
| 2012 | 1.19 | 1.20 |
| 2011 | 1.21 | 1.21 |
| 2010 | 1.11 | 1.10 |
| 2009 | 0.97 | 0.95 |
| 2008 | 0.90 | 0.90 |
| 2007 | 1.00 | 1.00 |
For each FY ending 2011, the total no of claims received about 20% or more than the number for FY 2006-07. The no of claims paid out has proportionally increased, keeping pace with the increase in claims received and sometimes higher.
To answer the titular question, “Has LIC’s death claim settlement capacity reduced over the years?” the answer is no relative to FY 2006-2007. The answer is yes relative to FY 2013-14
This is, however, not a cause for concern as an abrupt increase in claims received (14.6% in FY ending 2010 and 9.2% in FY ending 2011) led to a proportional increase in claims paid out (15.7% in FY ending 2010 and 9.7% in FY ending 2011).
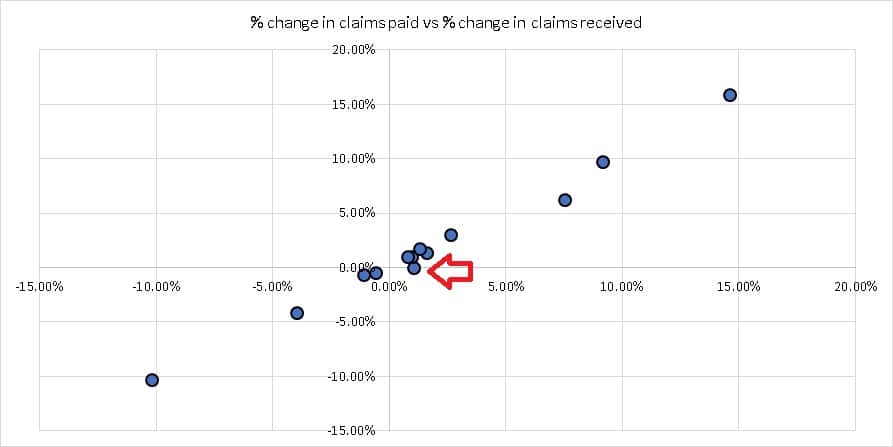
The data for FY 2019-2020 (red arrow) is an outlier, but at the time of writing, that could be a one-off and not a trend. The data for FY ending 2009 (3rd data point from right in the graph) was even more of an outlier.
Therefore, there is no evidence to show that LIC’s ability to settle claims has reduced over the years at the time of writing. The changes in CSR could merely be fluctuations. We like to reiterate that the results of this study have little bearing on individual claims.