Last Updated on December 29, 2021 at 5:30 pm
If you are interested in buying US stocks or if you are already invested, this is how different exposures would affect your portfolio risk and returns. Using S&P 500 in INR (dividends Included) and Sensex (dividends included) data from Sep 1996 to April 2020, we study different portfolio combinations.
We look at 10, 15 and 20-year investment durations with S& P 500 exposure ranging from 10% to 50%. While Indian investors can now invest in S&P 500 via Motilal Oswal S&P 500 Index Fund (Review: What return can I expect from this?) it is only used as a proxy for US equity in this analysis. Results with Nasdaq 100 or any other feeder fund should be similar.
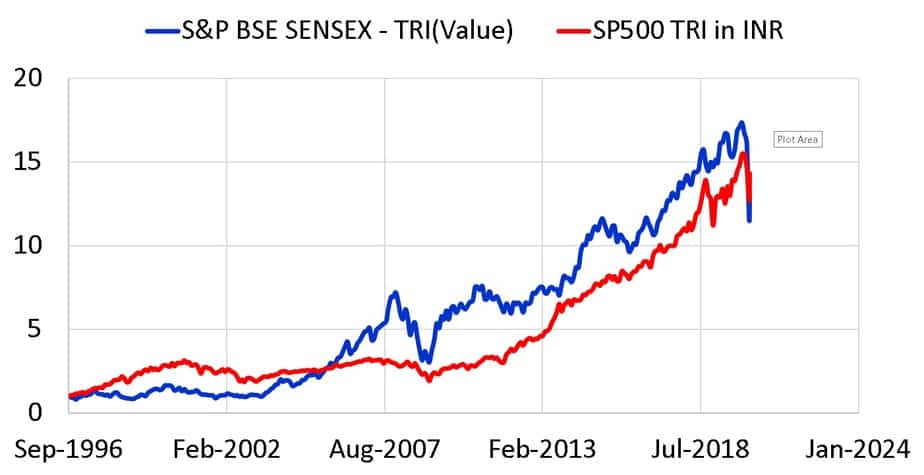
The full data set (monthly) is present above. Notice how the exchange rate has played a crucial role in reducing and moderating the risk of S &P 500 (in USD). Visibly, the red line is a lot less volatile than the blue.
🔥Secure your future with our Robo-advisory tool trusted by over 3,500 investors and advisors. From effortless retirement planning to funding your children’s biggest dreams, turn your financial goals into reality. 🔥
Subscribe for money management solutions via email! (Link takes you to our email sign-up form) Join 32,000+ readers in our community.
👉 New Tool Alert! NaviPlan: A Privacy-Focused Multi-asset Tracker and Goal Planner 👈
Instead of investing only in the Sensex (only the blue line) if we keep adding more and more of the red line, the volatility (for the above data set) will decrease. Returns will depend on timing luck. That is, it depends on the set of months over which the investment made.
Now consider a 15-year investment period ranging from Sep 1996 to Sep 2011 (1st run) and a 10% exposure to the S&P 500. We shall compare this with a 100% Sensex investment. The amount invested each month is assumed to increase each year at the rate of 5% (this will not impact the results).
The portfolio is rebalanced each year. Many investors assume “small exposures” such as 5% or 10% need not be rebalanced and can be left alone. This view is incorrect. This is how the 10% exposure to S&P 500 fluctuates each month during the 1st run with annual rebalancing.
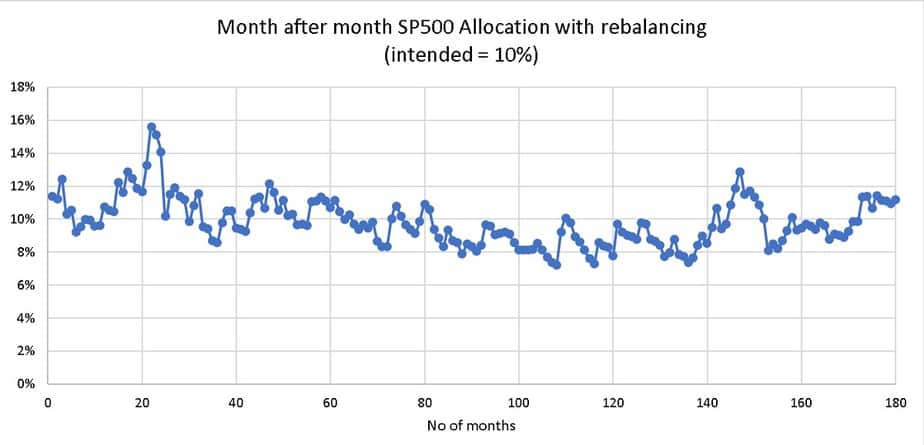
Notice how crucial rebalancing is in bring down (or up) the exposure to 10% periodically. If this was not done, the exposure would drift for the 1st run as shown below.

It should not be hard to imagine the impact of not rebalancing if there is 20% or 30% exposure to S &P 500. For the 1st run (Sep 1996 to Sep 2011) with annual rebalancing and 5% increase in investments, this is how the portfolios would evolve.
All images from this point on, incorrectly refer to Sensex as Nifty (force of habit). The error and inconvenience caused thereof is regretted.
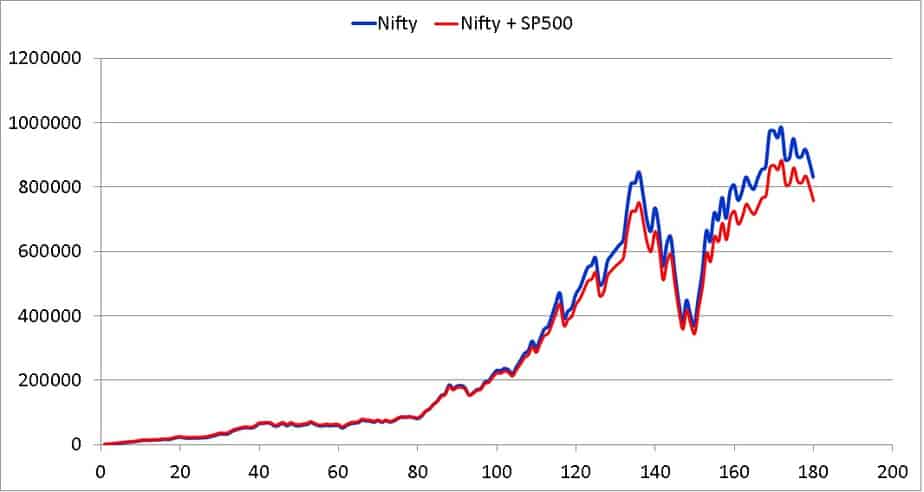
The XIRR for the Sensex-only portfolio in the 1st run is 16% and the 90% Sensex + 10% S&P 500 portfolio is 14.8%. We shall define a return difference (XIRR with S&P 500 – XIRR without) as -1.2%.
The 90% Sensex + 10% S&P 500 portfolio is 4% less volatility than the Sensex-only portfolio. That is, the beat is 96%. This data is for the 1st run.
The second run is from Oct 1996 to Oct 2011 (we have rolled over the 15-year window by one month. We compute the above nos, move on to the third round from Nov 1996 to Nov 2011 and so. We get 105 such runs.
The excess return obtained by including S&P 500 (XIRR with S&P 500 – XIRR without) and relative volatility (beta) for the 105 runs is shown below.
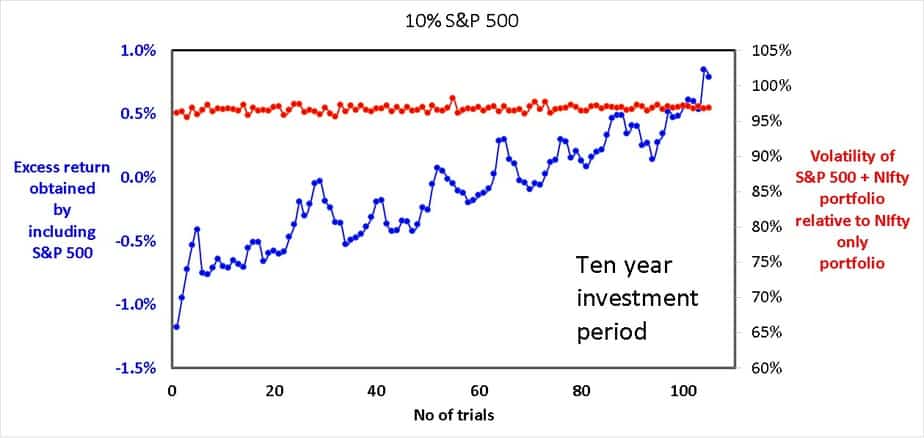
The average beta is 97%. Min excess return (worst benefit of including 10% S & P 500) is -1.18% and max excess return (best benefit of including 10% S & P 500) is 0.8%. Please note, tax and exit loads associated with rebalancing and tracking error and fund expense ratios are not included. This could conservatively take away about 2% of the final returns! Clearly a 10% S &P exposure does not have much benefit for the data set considered.
The impact of higher exposures for 10 and 15 year investment periods are shown below.
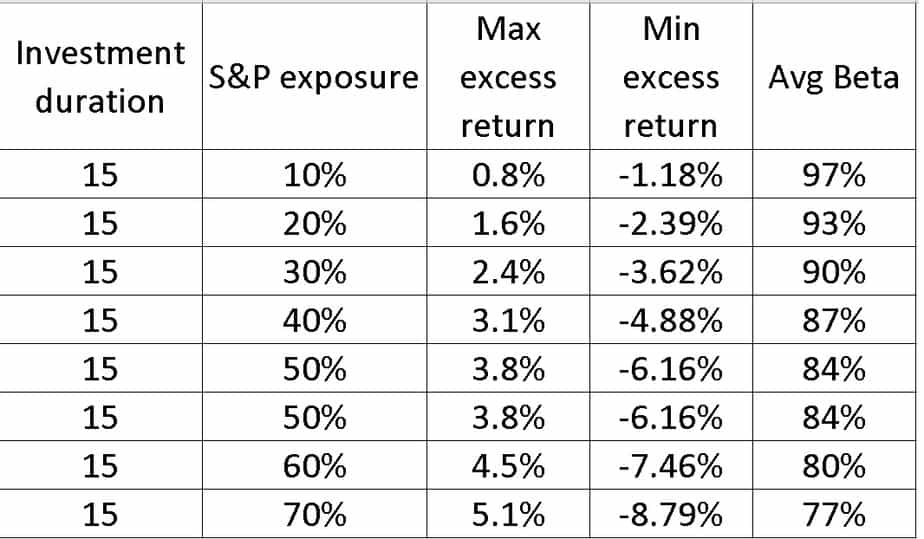
Notice that with higher and higher S&P 500 exposure, the portfolio becomes less and less volatile, but the spread bet the max benefit and min benefit increases. Even 30% exposure may not justify the maintenance costs (fund expense ratio, tax and exit load). Data for ten-year investment window is shown below.
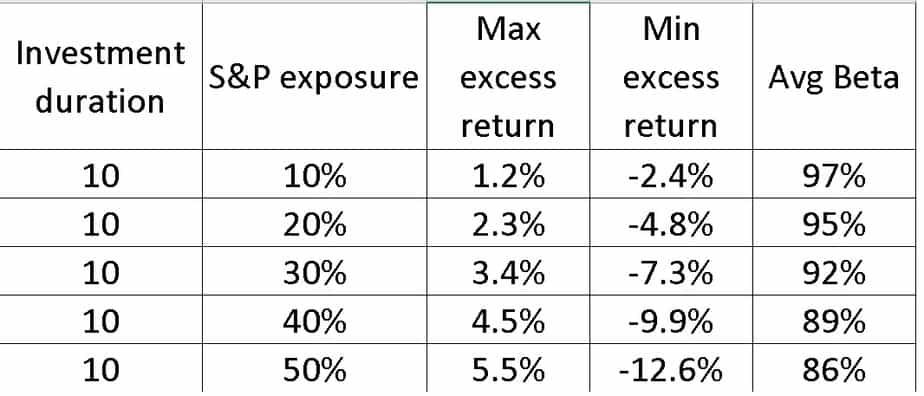
This spread is essentially a manifestation of the sequence of returns risk or in other words, sometimes things go your way and sometimes not! Just like timing the market, diversification lowers risk more often than not. However, the higher absolute reward is more of a coin toss.
Instead of annual rebalancing, one could rebalance based on moving averages to lower the return spread (lower not eliminate) but this would still require considerable exposure to justify the cost and labour. Read more: Timing the market will work but not the way we imagined!
Is separate US equity exposure via international funds worth all this trouble or should one stick with funds like Parag Parikh Long Term Equity or Axis Growth Opportunities and get “some” US stock exposure without the hassle of rebalancing and tax (but higher fund management fee)? Read more: Axis Growth Opportunities Fund vs Parag Parikh Long Term Equity Fund.
The primary benefit of including US equity is to lower portfolio risk and with the associated managed it can be achieved. However, most investors are lazy and do not bother to educate themselves that diversification could lower investment returns along with investment risk! They see something shiny and want a piece of that action. This can only lead to confusion and clutter. “Diversification benefits” require continuous maintenance.
Even if buying Indian mutual funds that invest in international stocks may not lower risk as efficiently as using dedicated international exposure, it is a whole lot easier! My vote is for the easier option.