Last Updated on May 14, 2022 at 7:52 pm
In this article, we explain how you can quickly and easily benchmark your equity mutual fund portfolio consisting of several mutual funds against an index fund (or ETF). Once you follow the steps below, you can check the performance of your portfolio against the index at any time.
We shall be using the Freefincal MF Portfolio Tracker on Google Sheets to accomplish this. In another article, we shall explain how to benchmark a stock portfolio. New readers can check out the video guides in the above link before proceeding.
Shown below is the Screenshot of SIP in Quantum Long Term Equity (QLTE) Fund in the tracker dashboard. This is for a SIP in the fund since April 2006. For simplicity, we have shown only one fund in the portfolio but up to 30 funds can be benchmarked.
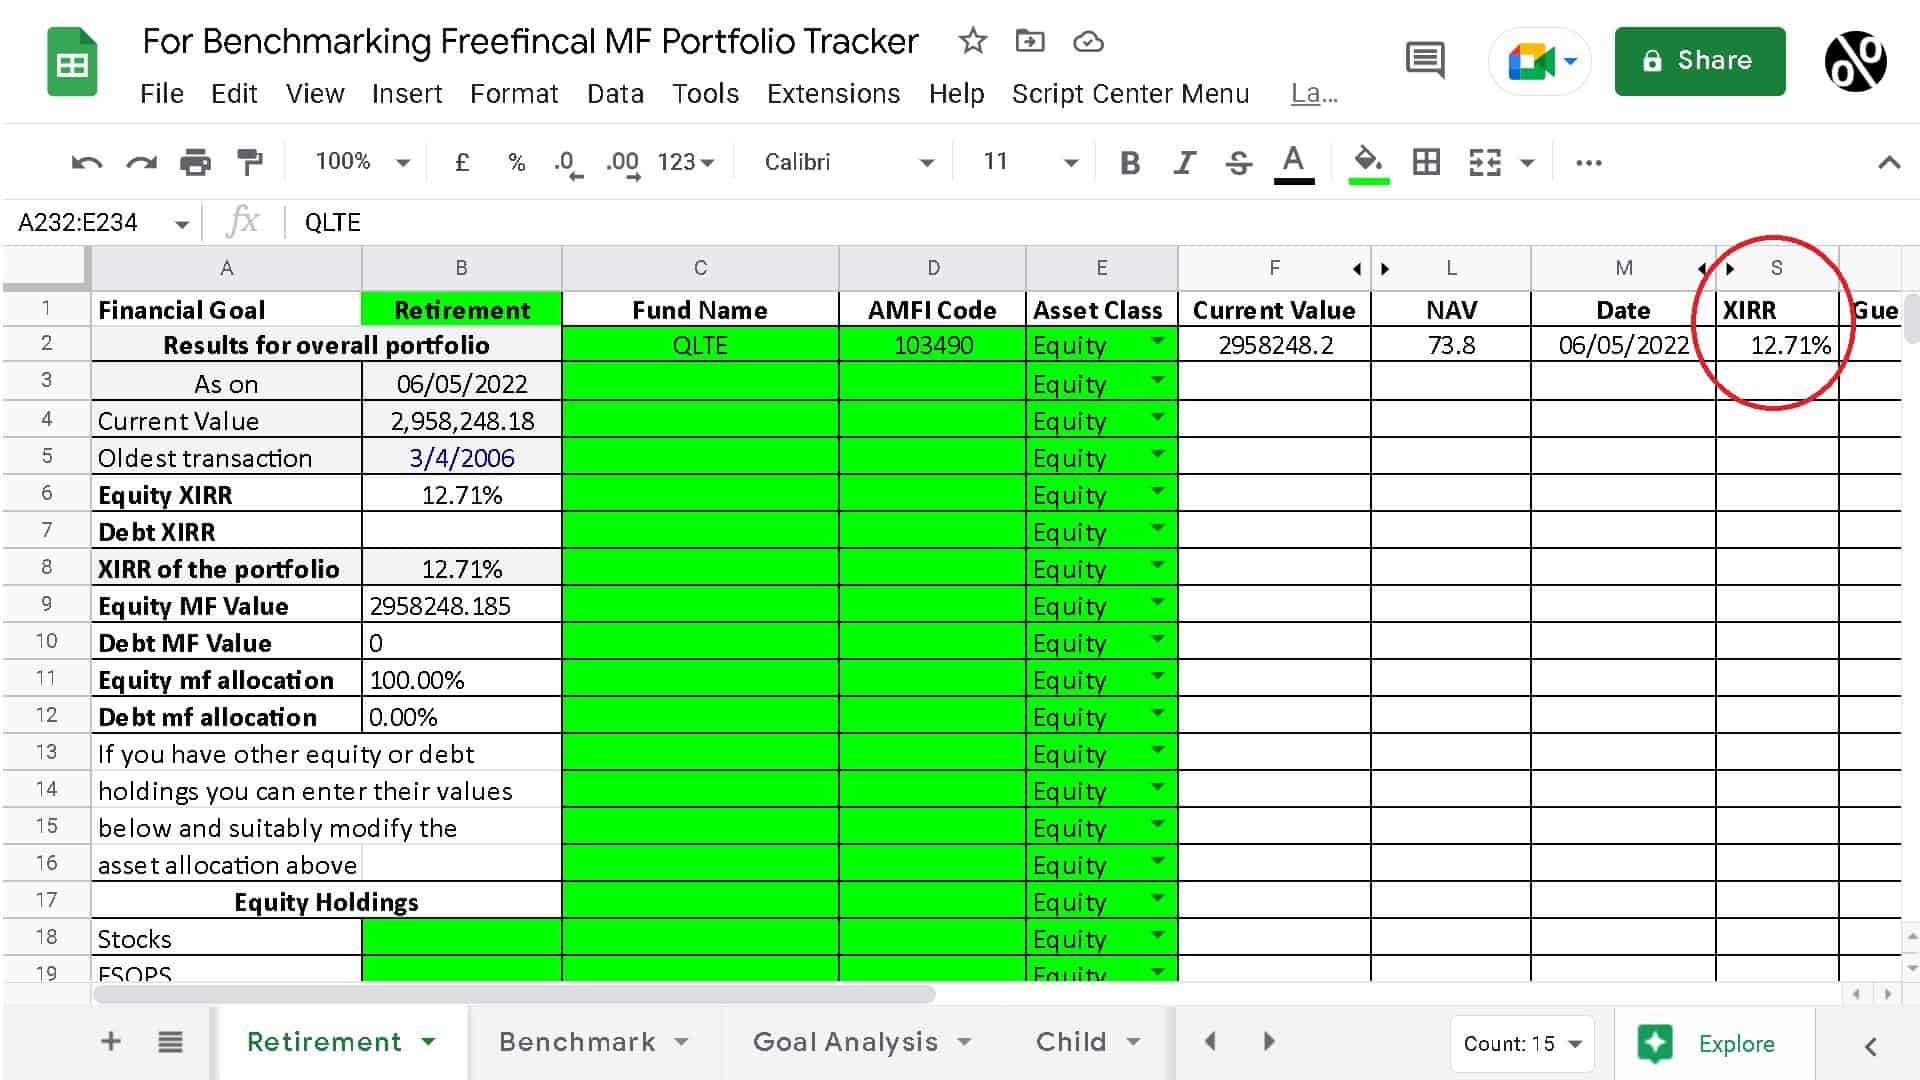
Duplicate this sheet and call it “Benchmark” or any other name you prefer. If you are invested in equity and debt mutual funds, then you will have to remove the debt transactions before proceeding. If you have a lot of transactions, you can copy them out in a different sheet and filter out the debt funds by name. Also, dividend transactions will have to be removed as they cannot be benchmarked.
🔥Secure your future with our Robo-advisory tool trusted by over 3,500 investors and advisors. From effortless retirement planning to funding your children’s biggest dreams, turn your financial goals into reality. 🔥
Subscribe for money management solutions via email! (Link takes you to our email sign-up form) Join 32,000+ readers in our community.
👉 New Tool Alert! NaviPlan: A Privacy-Focused Multi-asset Tracker and Goal Planner 👈
Choose an index or ETF to benchmark against. If your portfolio is older than 1st Jan 2013 then you will have to choose regular plan funds or ETFs as the benchmark. ETF NAV may not be available for all dates from April 2006. This method will work only for transactions on or after 3rd April 2006.
We shall choose the UTI Nifty Index fund Regular Plan growth option and use the “Latest NAV” sheet to locate its AMFI code (instructions are available in the sheet).
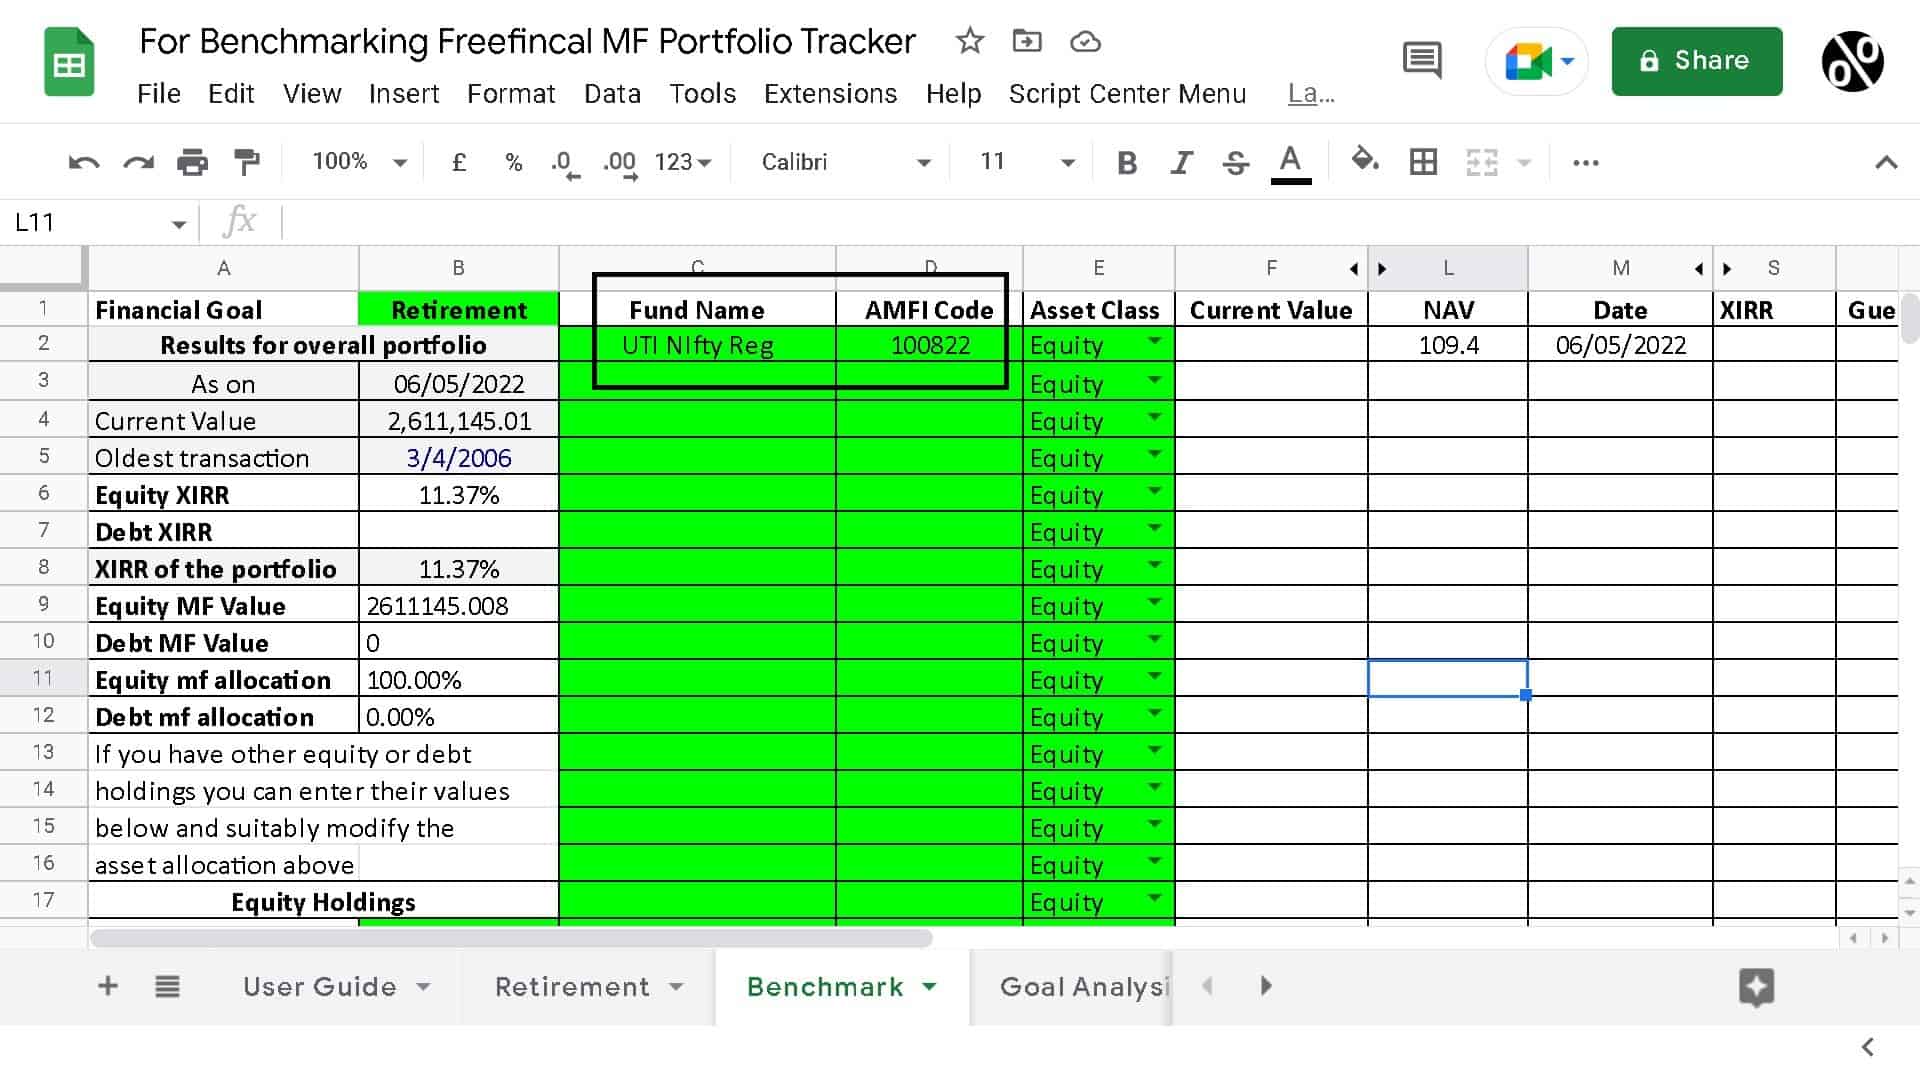
In the sheet titled “Benchmark”, change the fund name and the AMFI code to that of the benchmark. The XIRR will not yet be computed as the transactions need to be fixed.
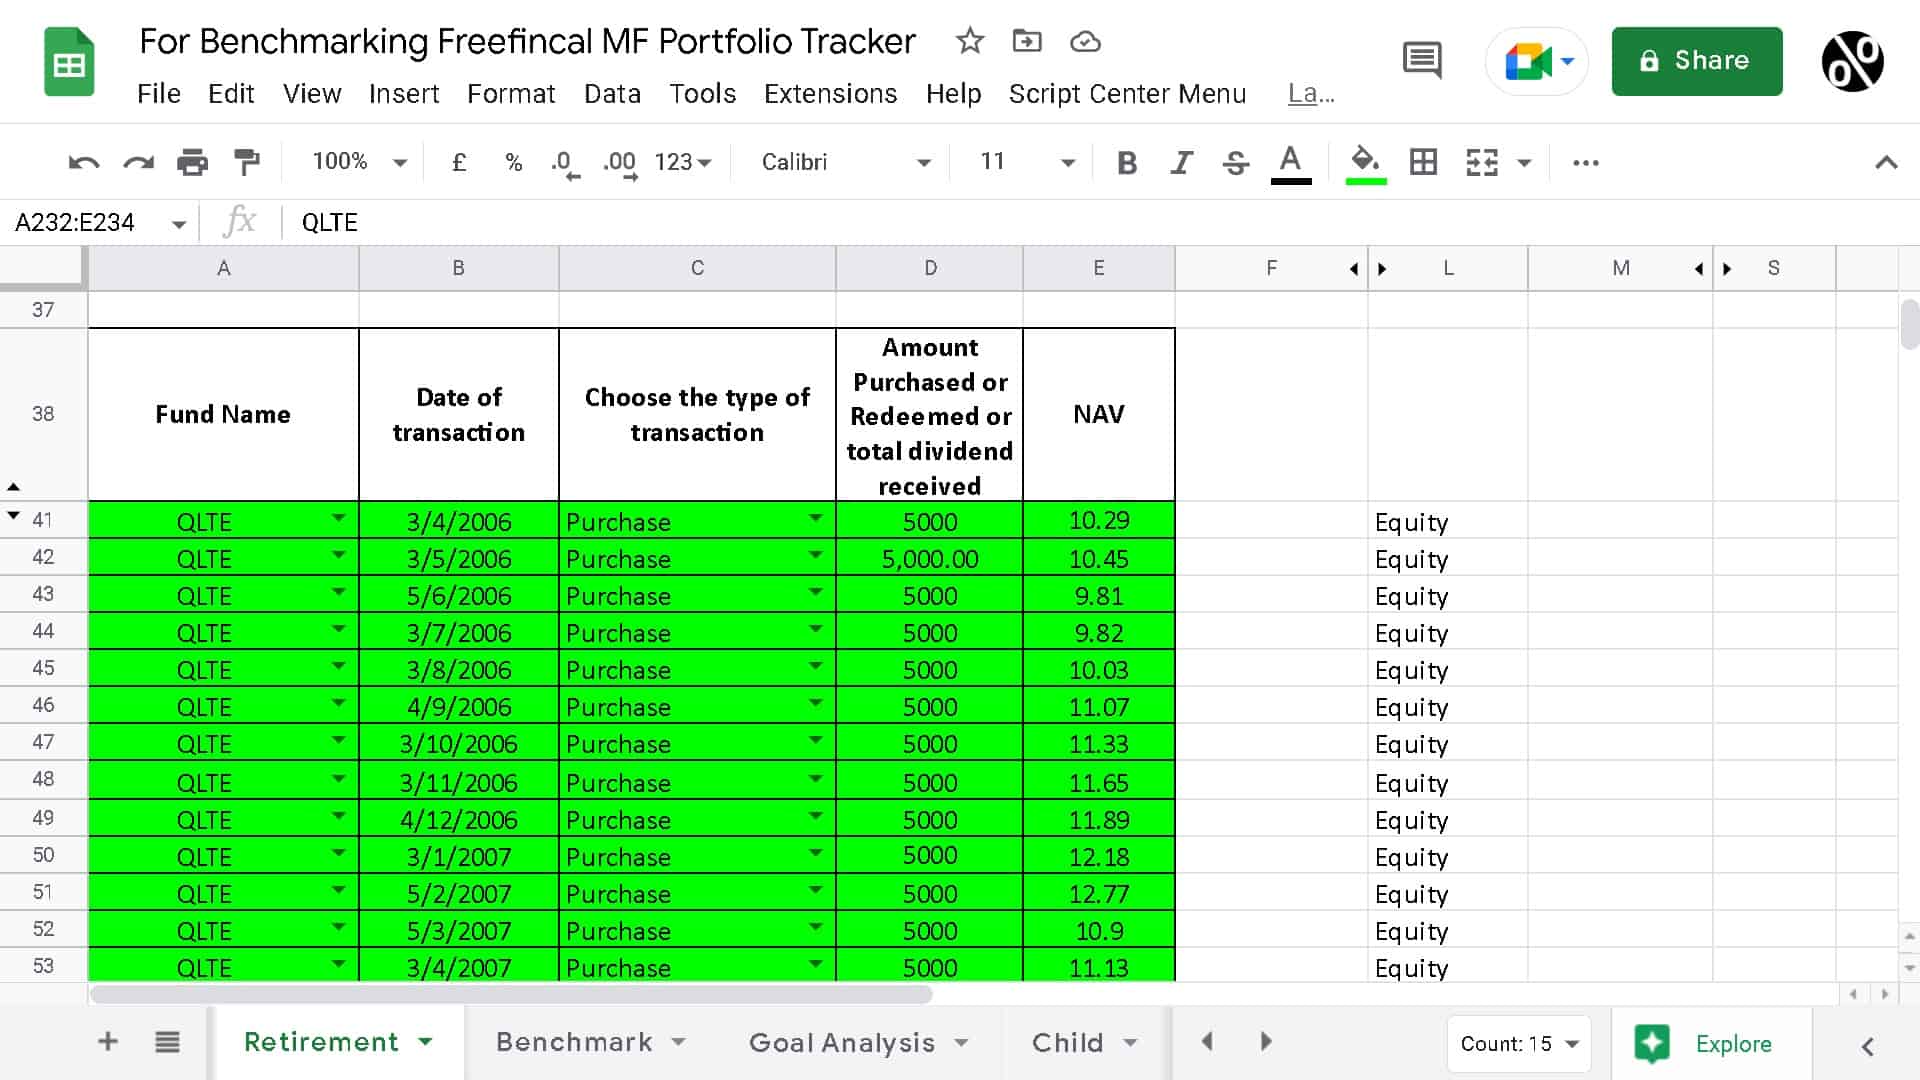
These are the QLTE transactions in the retirement sheet.
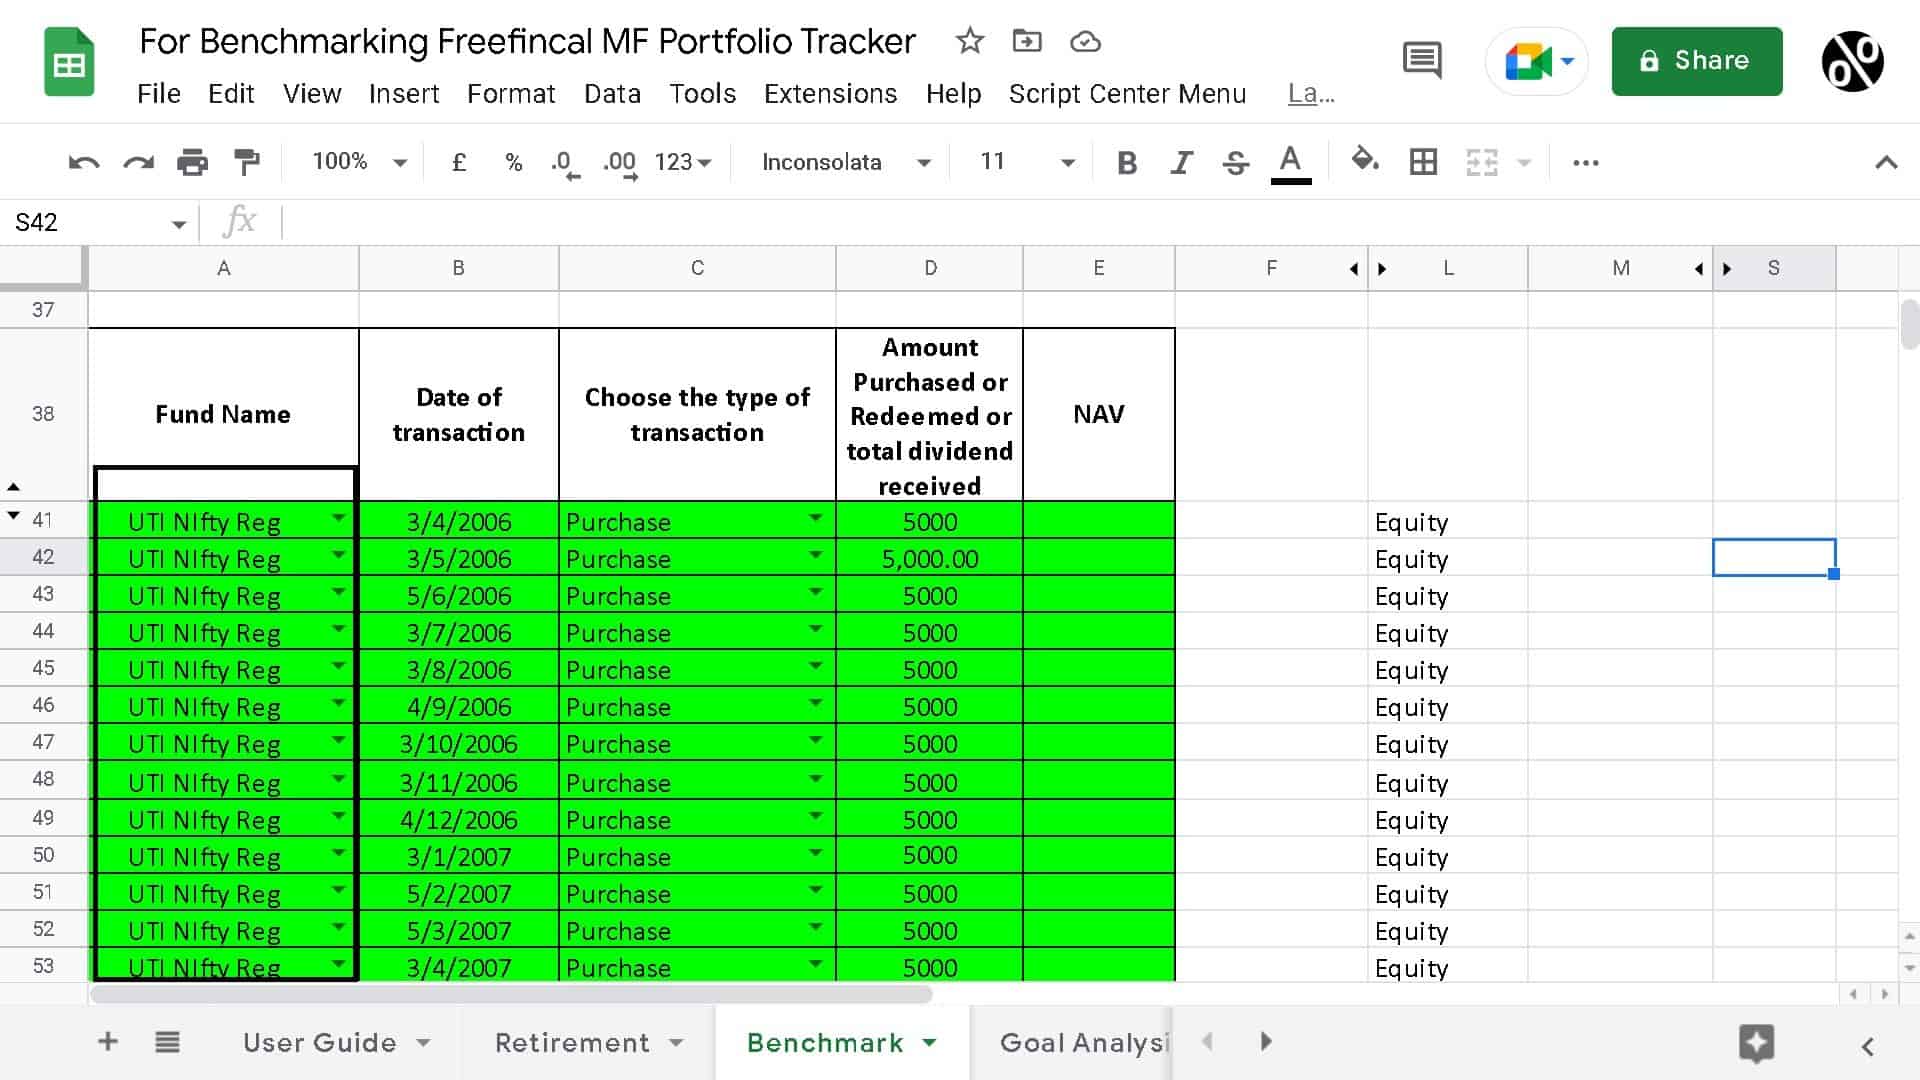
When you duplicate the retirement sheet to “benchmark”, (1) Change the name of the fund in the first cell and then copy it down. (2) Delete all NAV entries and (3) copy the dates. Note: If you have debt mutual fund entires, they will need to be removed at this stage.
Go to the sheet “Find NAV” and enter the fund name and AMFI Code. This sheet will have entires to find the NAV for 10 given dates. You can copy down columns A and B to any number of rows (well up to 10,000!) to suit the number of transactions you have.
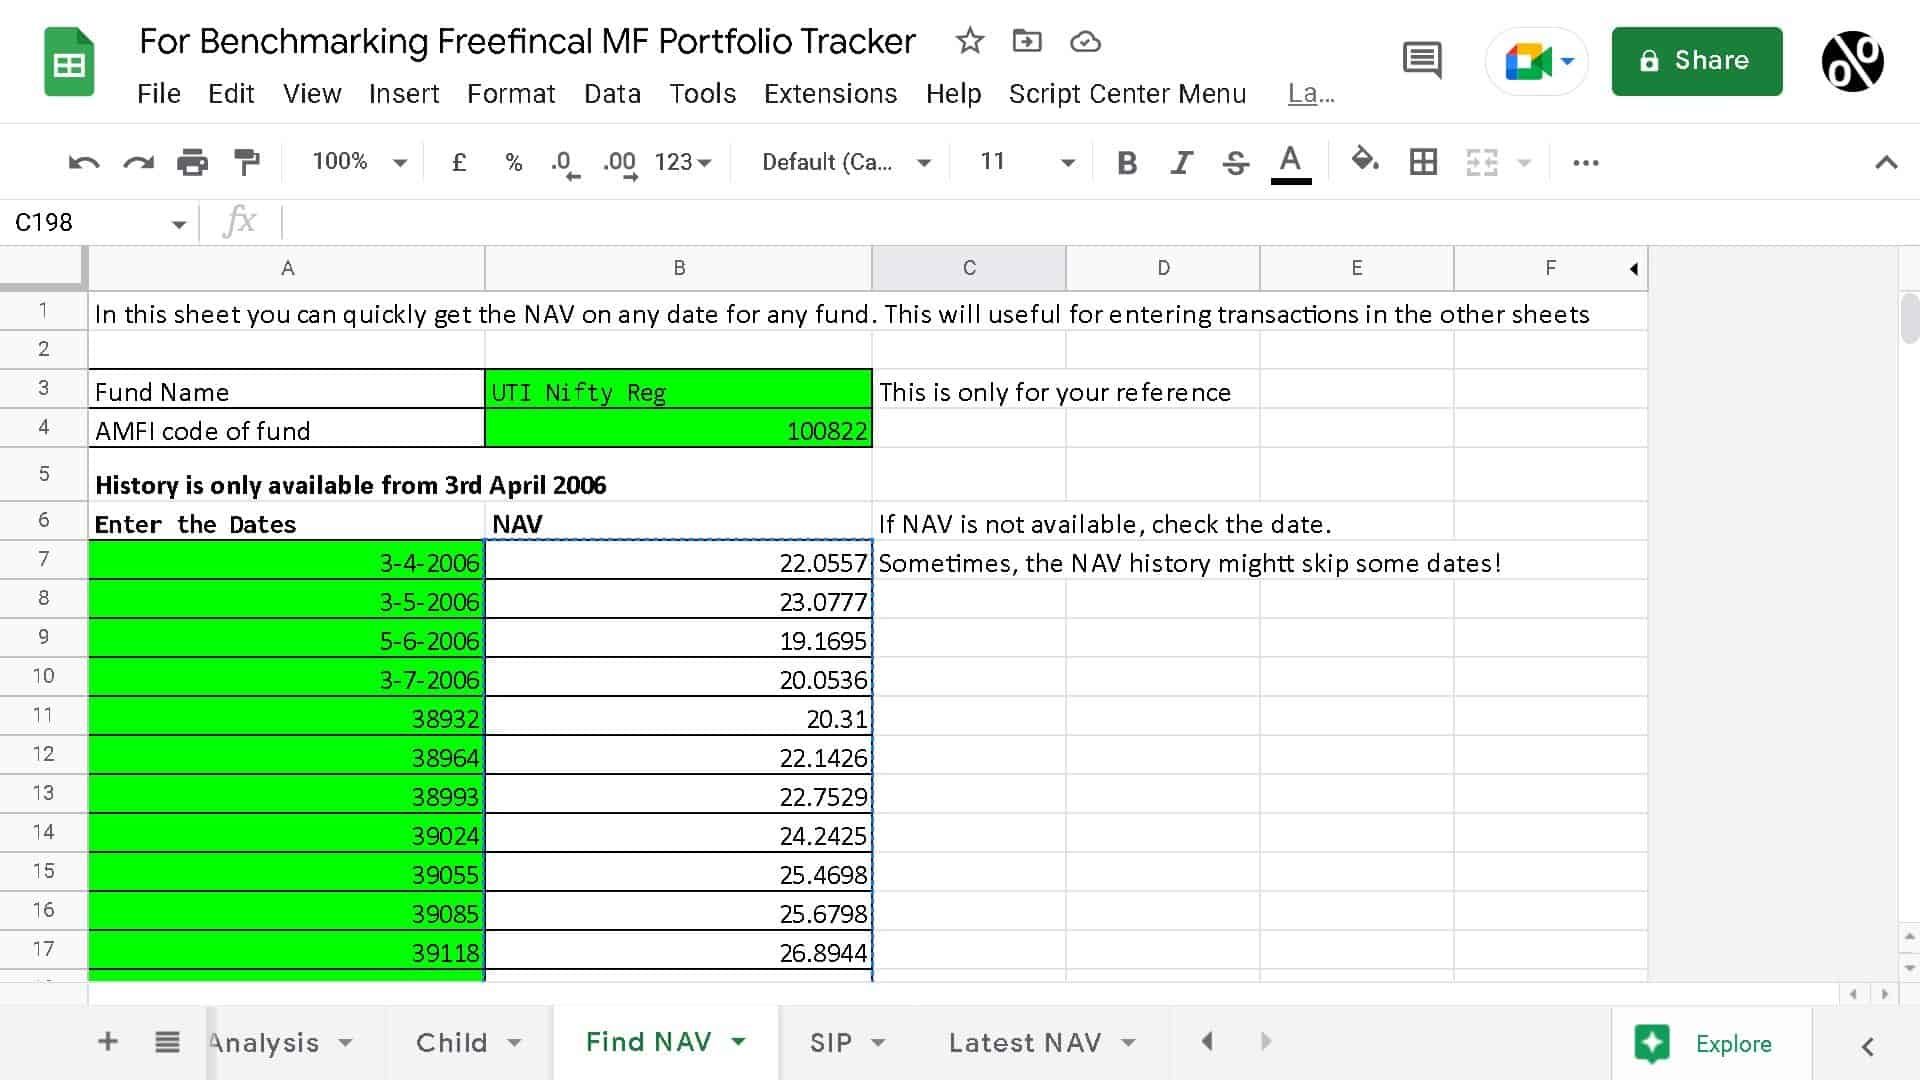
Paste the transaction dates from “Benchmark” to Col A of “Find NAV”. You will get the NAV of the benchmark index for the corresponding dates of your transactions. Copy the relevant NAV cells and paste the values into Col E (row 41 and below) of “Benchmark”.
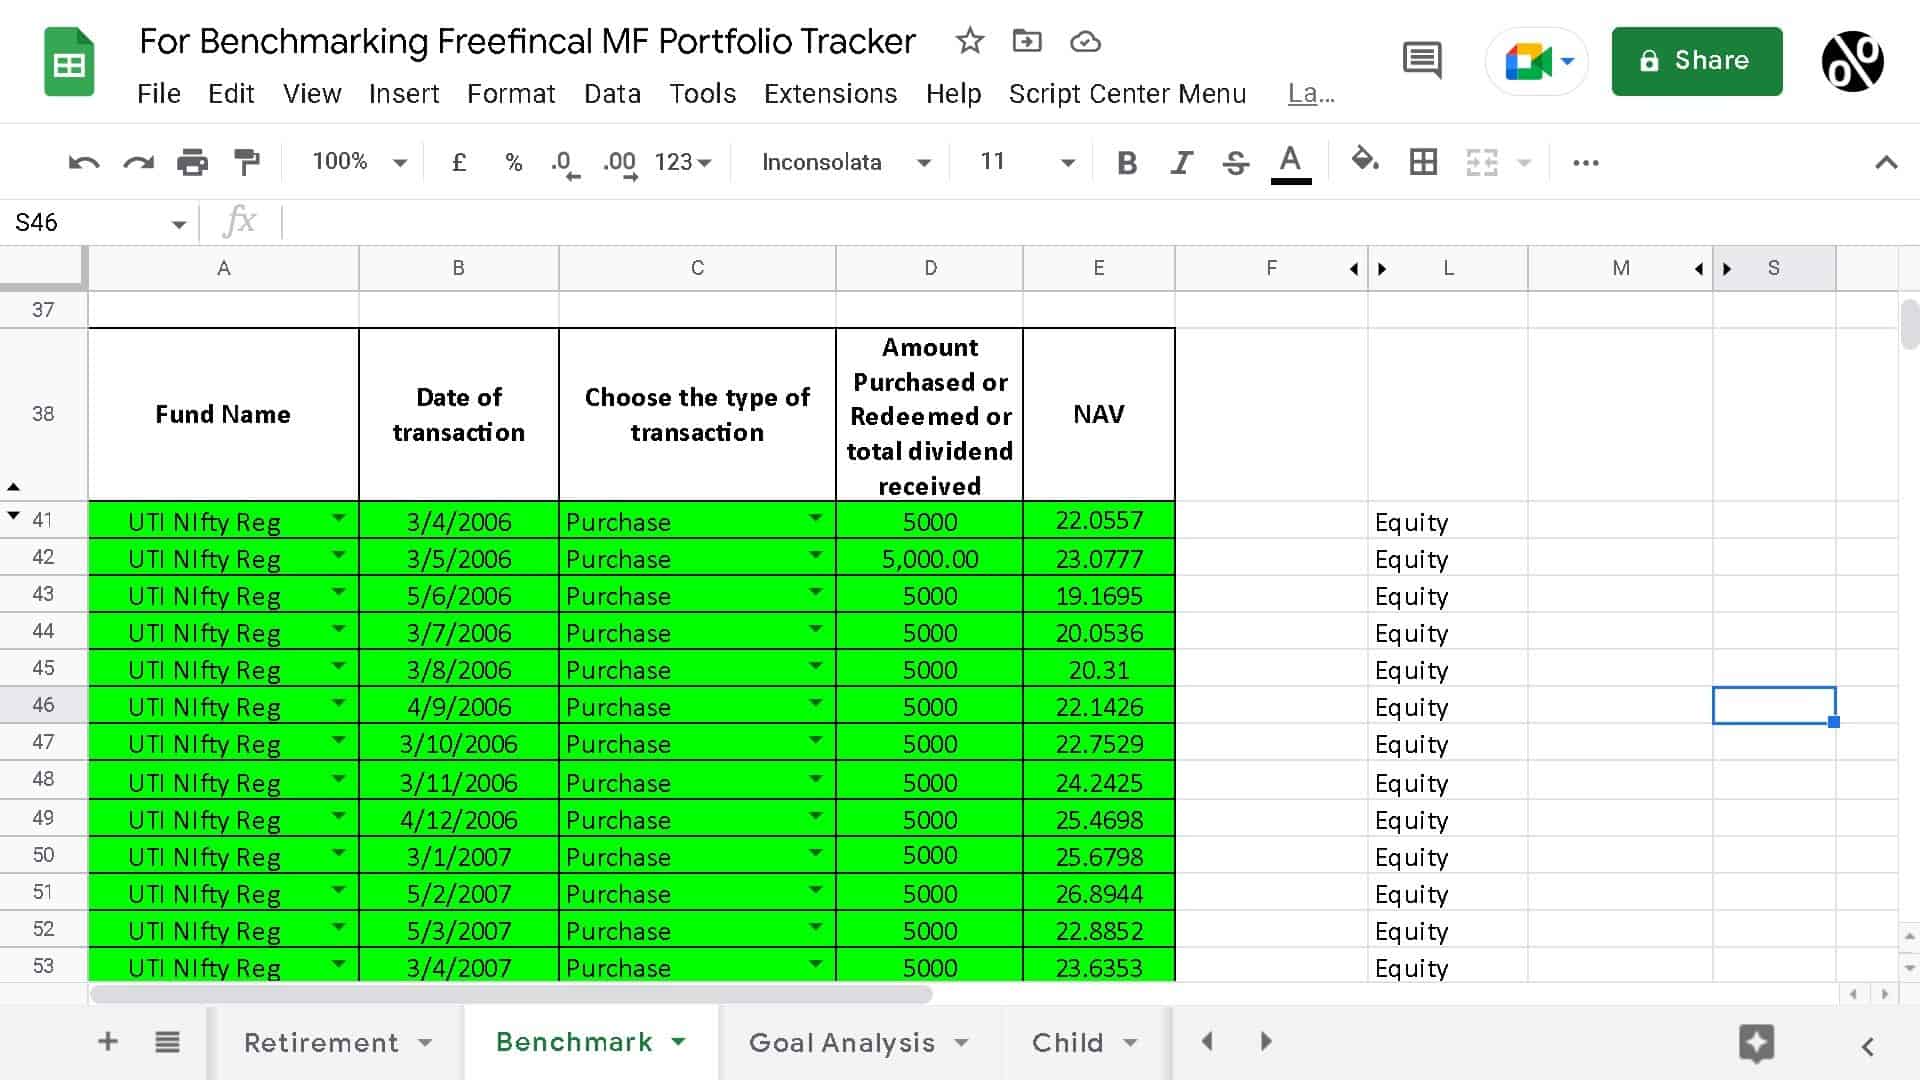
That is it! Scroll up and look at the XIRR. This is the XIRR of the benchmark index for the same dates and types of transactions in your portfolio.
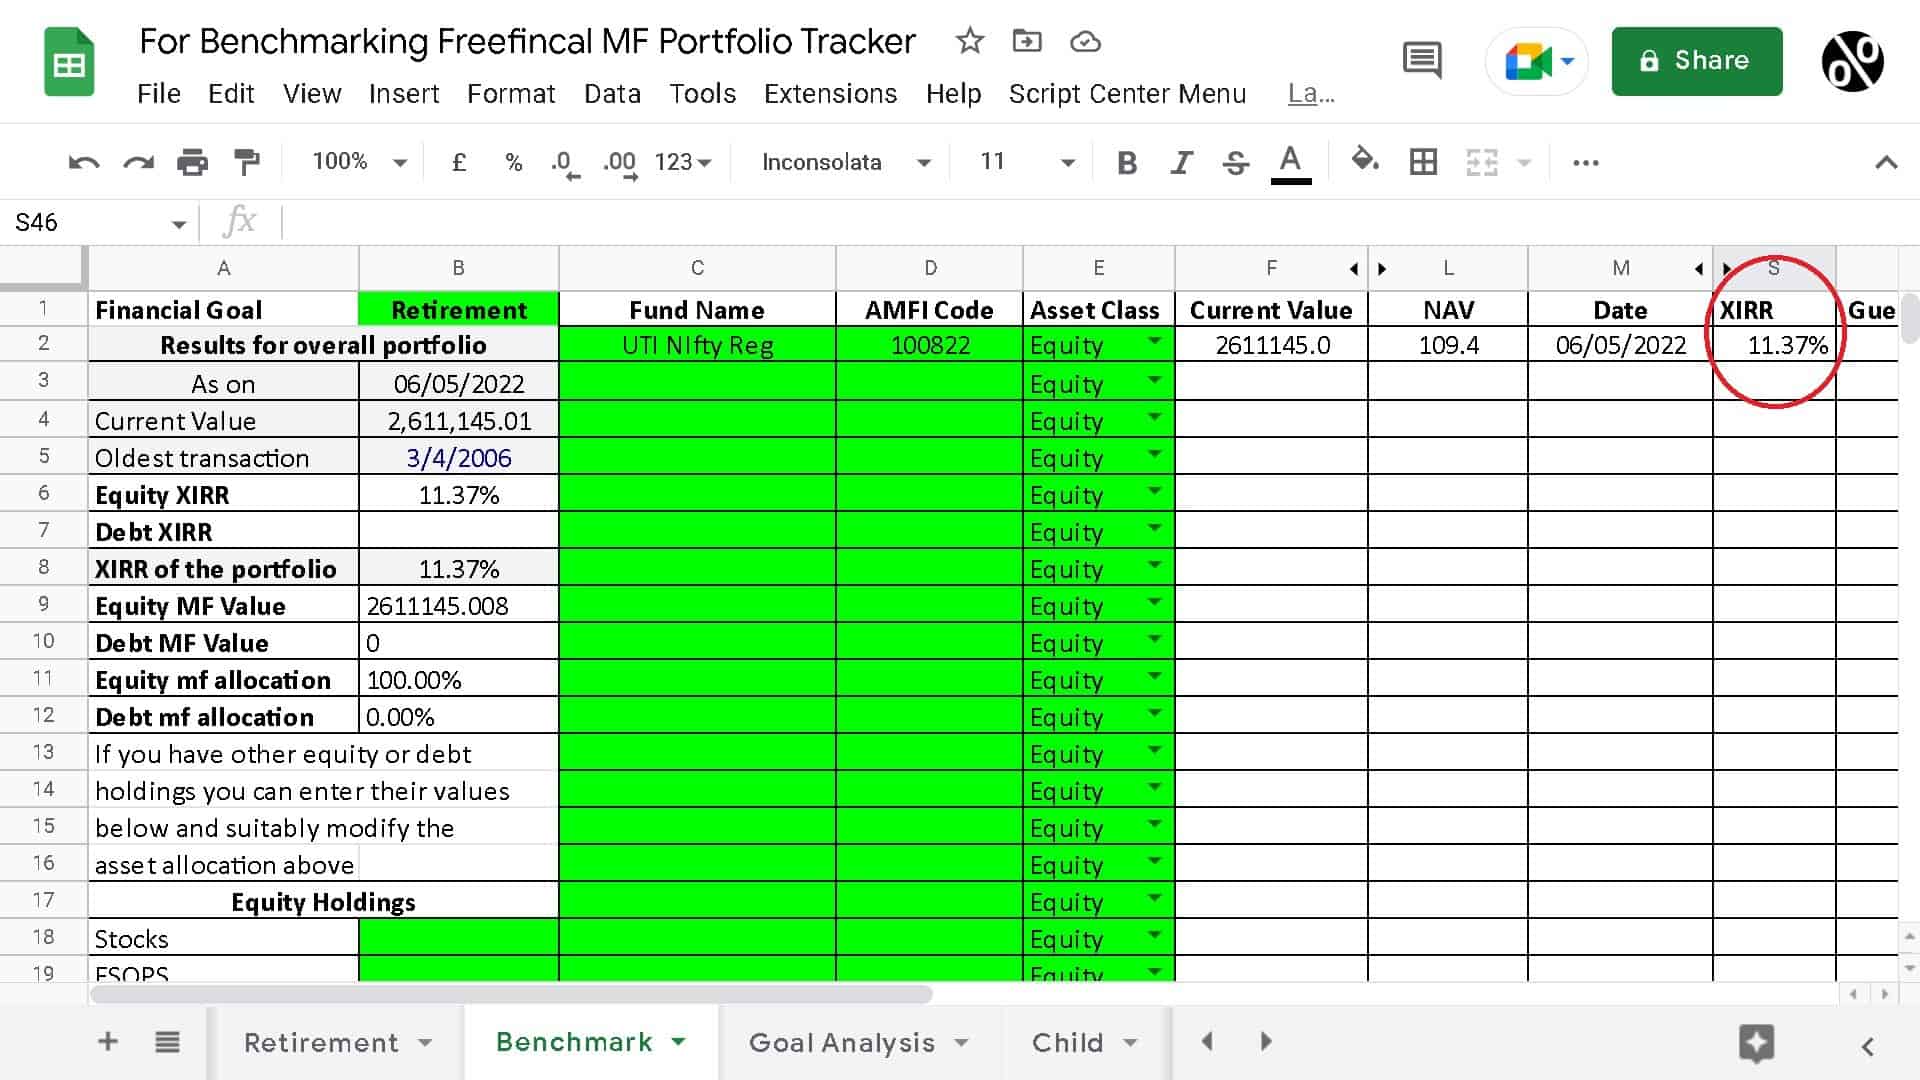
So the XIRR for a SIP that is ongoing since April 2006 is 12.71%. If you had invested the same amount in the UTI Nifty Index fund regular plan the XIRR would be 11.37%. Of course, for portfolios started after 1st Jan 2013, the comparison can be done with direct plans.
The above benchmarking process can be done in just 15 minutes even for a new user. Transactions made later can be easily added by the same process.
To learn more about the other features of the mutual fund (and stock) portfolio tracker, please refer to these video guides. You can get the tracker here: Track your mutual fund and stock investments with this Google Sheet!
Mutual Fund Portfolio Tracking
How to benchmark your mutual fund portfolio
Stock Portfolio Tracking