In the first of a two-part series, Vijay discusses how to build a direct equity portfolio.
About the author: Vijay is an electronics engineer and management graduate (IIM Bangalore). He has worked as a technical expert in the automotive industry for the last 25 years. He has an active interest in subjects related to macro Economics, wealth building and technology matters. He has an investing experience of close to 15 years in equity and mutual funds.
Note: Opinions published by guest authors do not represent the views of freefincal or its editors.
About the article: This is an attempt to assimilate the learnings related to portfolio building from different practitioners, including my personal experiences with direct equity investing.
Before delving into the details of direct equity investing, it is helpful to understand the different mechanisms by which people aim to generate money in the stock market. At the top level, we can divide them broadly into Trading & Investing based on the time horizon.
🔥Secure your future with our Robo-advisory tool trusted by over 3,500 investors and advisors. From effortless retirement planning to funding your children’s biggest dreams, turn your financial goals into reality. 🔥
Subscribe for money management solutions via email! (Link takes you to our email sign-up form) Join 32,000+ readers in our community.
👉 New Tool Alert! NaviPlan: A Privacy-Focused Multi-asset Tracker and Goal Planner 👈
The motivation for trading is to secure higher returns in the short term compared to investing, which is more long term oriented. Naturally, the risk in trading is much higher.
Trading can further be classified into Scalping, Day Trading and Swing Trading. A very brief overview of the different trading strategies is given below.
Scalping: This is a variant of day trading where the trader focuses on selling with small profits that add up. The profit volume is increased by executing any such trades in a day (e.g. 100). In scalping strategy, buying and selling are finished ranging from a few seconds to a few minutes, and they typically use 1-minute charts. Since the incremental gain per trade is small, the number of shares per trade is also higher than day traders.
Day Trading: This involves buying and selling on the same day and is referred to as Intraday Trading. Trading is done not just on stocks but also on Commodities, Currencies or financial instruments like derivatives {F&O}. Traders use technical analysis to study the different patterns and decide on the transactions.
Swing Trading: This trading strategy involves studying the charts to anticipate and identify “Swings” in stock price movement. Compared to scalping and intra-day trading, Swing Traders keep the position open for days and sometimes weeks. Swing traders use relatively long term charts (e.g. monthly) compared to the 1-minute & 5-minute charts used by Scalpers and Intraday Traders. Regarding working style, Swing Traders do not have to follow the market hourly closely. Still, they have to follow the other developments related to the company, like Company Earnings or other policy-related news (e.g. RBI monetary policy updates, …).
To put things in perspective, if I take a cricket analogy, Scalping is more like a Super over in Twenty 20, while Day Trading is akin to a 50 overs ODI match. Swing Trading is more like betting on a team over an entire IPL season based on team composition and playing conditions.
Portfolio Building: To diversify risk, we have all heard the saying, “Don’t put all eggs in one basket”. A SEBI-registered financial advisor will advise you on how to build your overall Portfolio consisting of different asset classes: Equity, Mutual Funds, Gold, Bonds and Real Estate. But this article is about zooming into the world of Direct Equity investing and how to build a Portfolio of Good quality Stocks over the long term.
To do that, it becomes important to understand some basic elements of the stock market and macroeconomics.
The main players in the stock market are Foreign Institutional Investors (FII), Domestic Institutional Investors (DII), High Net worth individuals (HNI’s) and Government.
Fiscal policy decisions taken by the Government (e.g. changes done to Income Tax rates, Reduction of corporate Tax, Subsidies) affect actions taken by companies and investors.
Monetary policy decisions taken by the Reserve Bank of India (e.g. Quantitative tightening measures like an increase of interest rate to control inflation or Quantitative easing measures like reduction of Repo rate) also impact the stock market. As the world economies are connected, decisions by developed economies like the US also affect the Indian equity market (for example, the impact of US Federal bank rate hikes on the RBI repo rate).
These Fiscal and monetary policies play a role in moving the demand and supply curves, thereby eventually impacting the Stock price.
The printing of money by the government directly leads to inflation and impacts stock price movement. During the COVID-19 crisis, the US government printed a lot of money, resulting in the high Inflation that you see today in the US. On the other hand, India did not indulge in quantitative easing to the same extent as the US. Still, it focused on a good mix of Fiscal measures (i.e. Free food grains to 800 million people, cash transfers to lower-income households, support schemes targeting MSMEs,..).
Money loses value every year due to the rate of Inflation. If you use any of the Inflation calculators available online, you can see that money of X can go down to X/4 in real terms in 20 years, considering 7% inflation. Or in other words, if you need six lakhs/annum today to maintain a standard of living, you will need 24 lakhs/annum to maintain the same standard of living 20 years later – thanks to inflation.
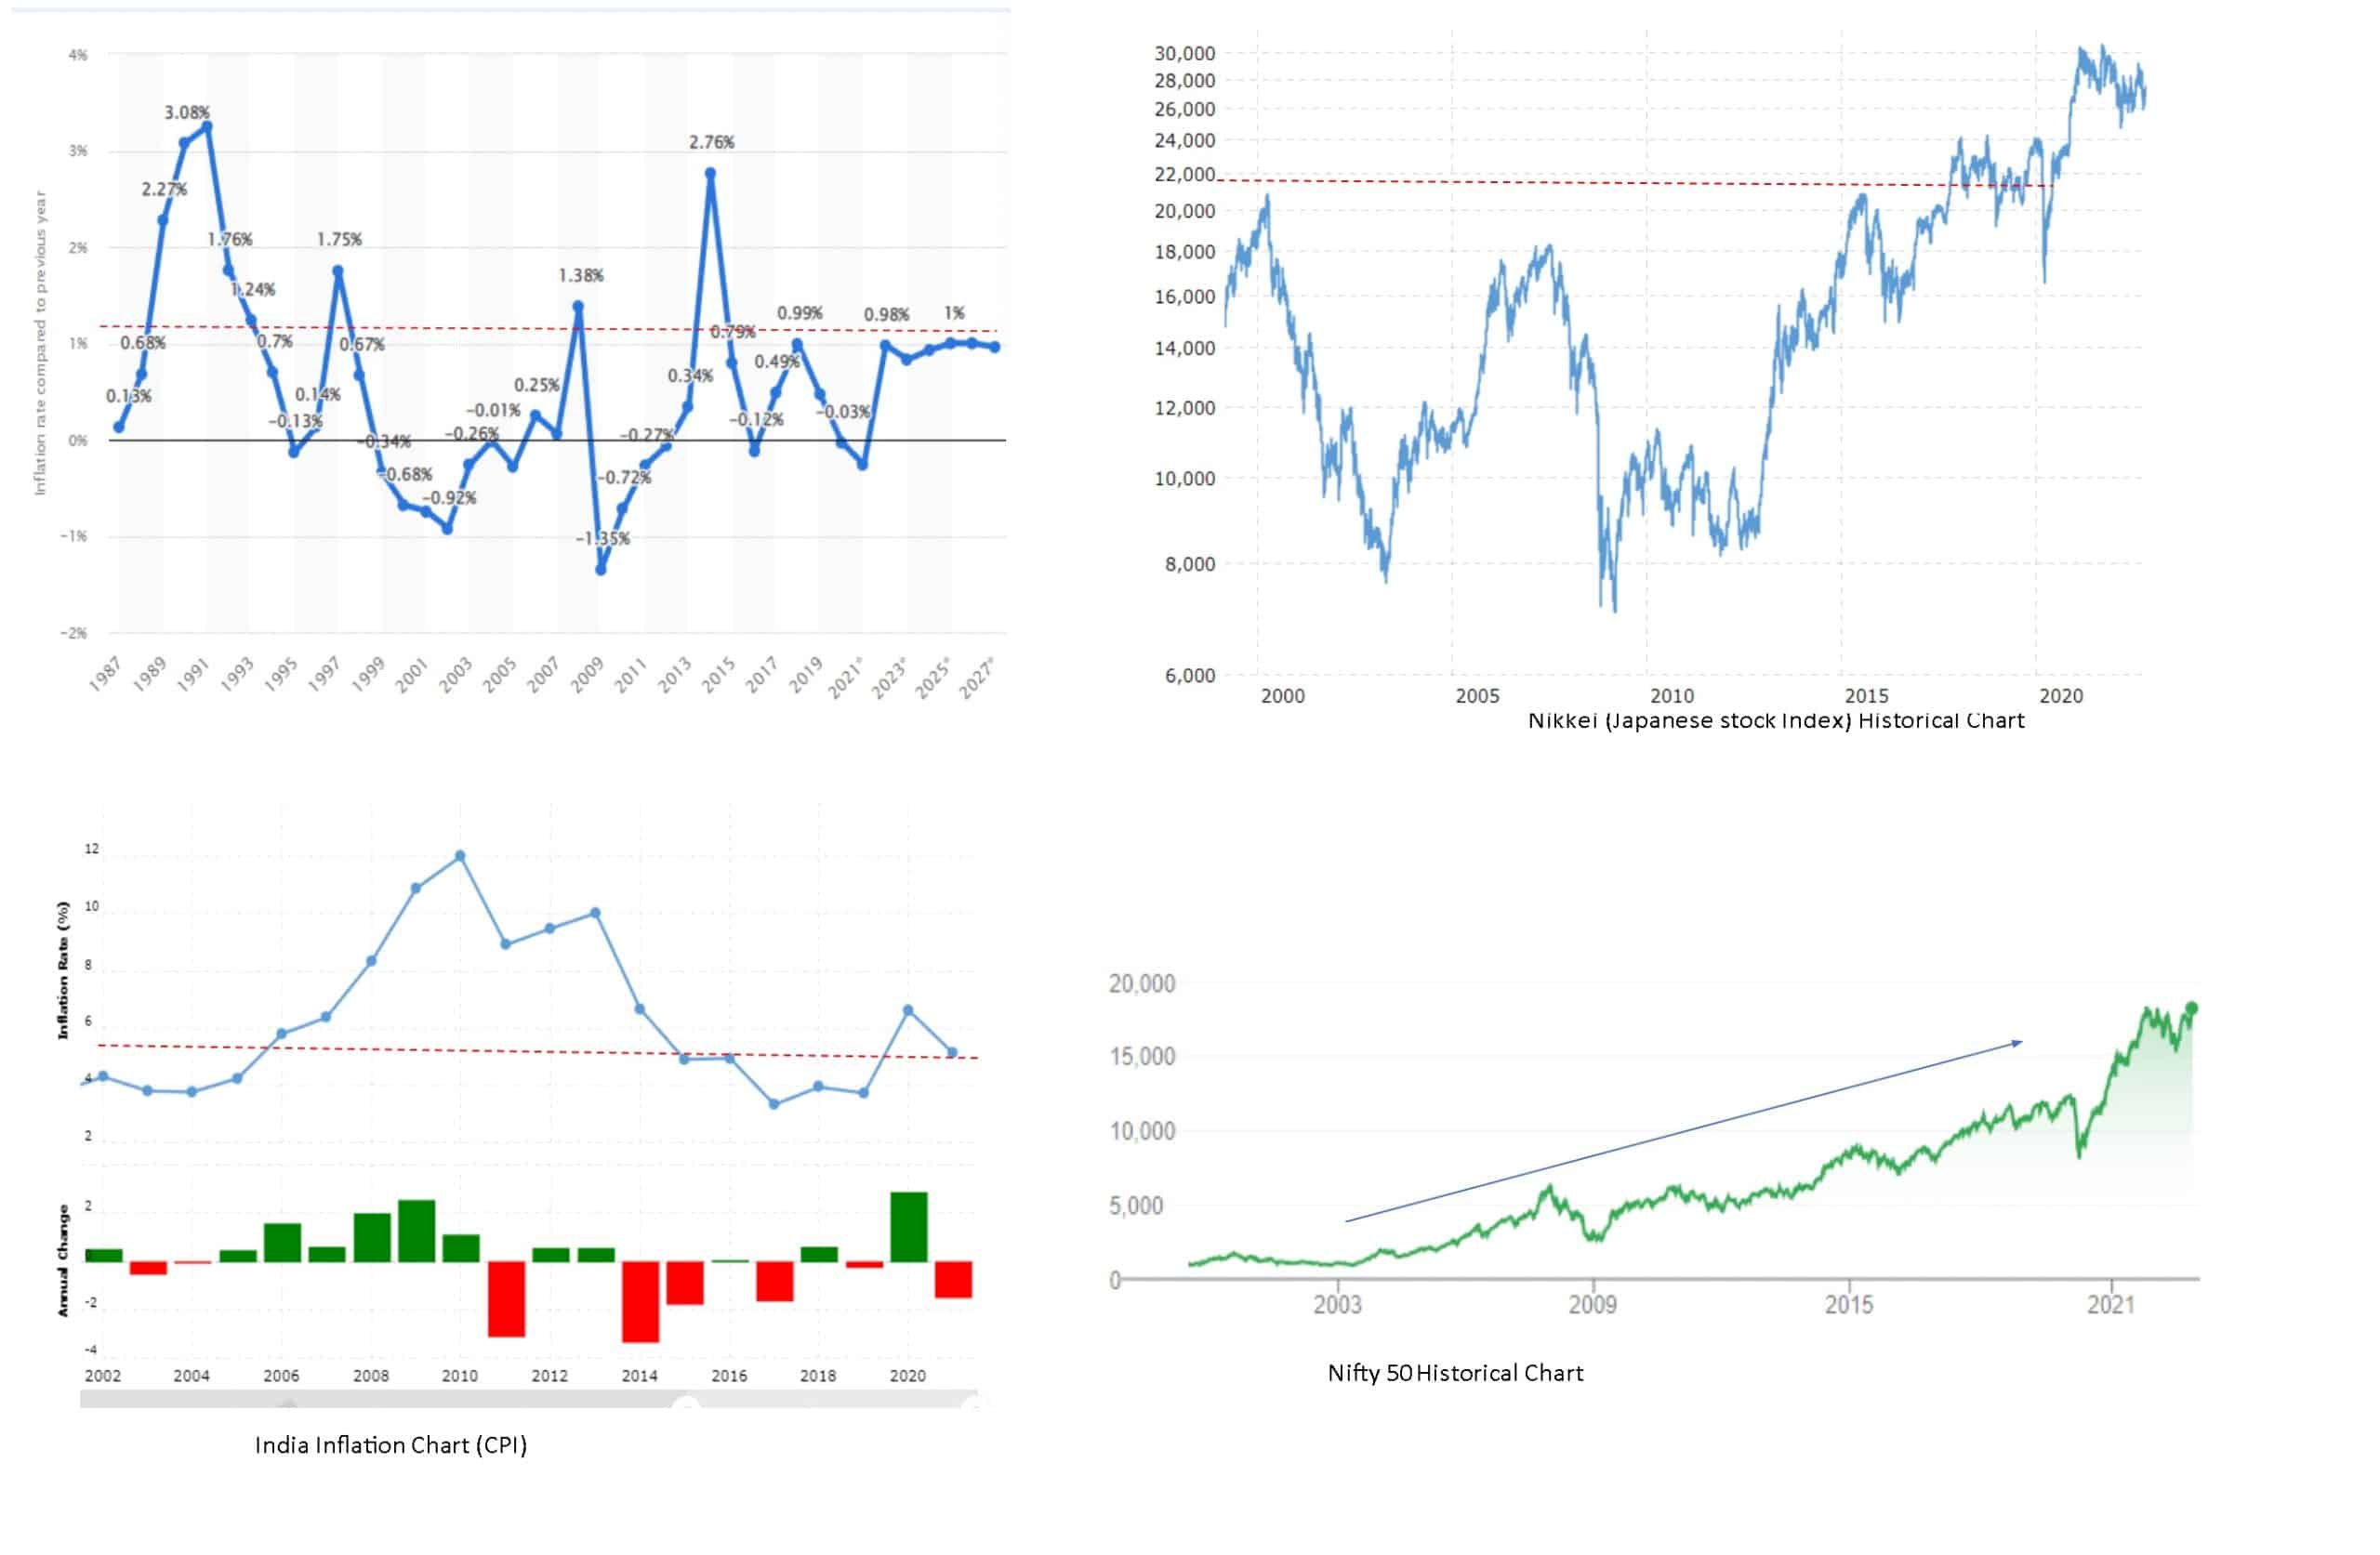
In the long term, the stock indices (i.e. Sensex, Nifty) are bound to go up as this is linked to Inflation and GDP. A comparative look at Japanese Inflation and the corresponding stock index chart vis a vis the history of India’s inflation along with Nifty growth is given below. As you can see, Japanese inflation has almost been in the range of (0-1%) in the last 20 years, sometimes even negative. The Nikkei stock index has hardly grown in the same period (20K in March 2000, 20K levels in Mar 2020). Contrast this with the Indian inflation, which has been more than 5% for the last 20 years. Nifty in this period has grown more than 30% CAGR.
Lastly, Portfolio building through direct Equity Investing is like running a marathon. Once we pick good quality stocks in our portfolio after due research steps that we will see, there is no need to react to every bit of news about the company. We should develop the ability to analyze the news without being emotional.