Last Updated on July 25, 2016 at 2:40 pm
My wife hates personal finance! If I want her out of the room, all I need to do is to utter words/phrases like, freefincal, goal-based investing, CAGR, retirement planning (most effective!), just about anything that is not metallic, shiny and yellow in colour!
Therefore, you can imagine my surprise when she handed me a diary and said, “write a post on inflation with this”!
It was a diary of monthly accounts maintained by my parents from Jan. 1995 (to Jan. 2006 when we took over after my late fathers illness). We have records before that as well, all the way down to the 1950s maintained by my grandfather. Will try and dig those up someday.
Here are some inflation figures obtained by comparing individual entries in our Jan 1995 budget with May 2014 budget.
🔥Secure your future with our Robo-advisory tool trusted by over 3,500 investors and advisors. From effortless retirement planning to funding your children’s biggest dreams, turn your financial goals into reality. 🔥
Subscribe for money management solutions via email! (Link takes you to our email sign-up form) Join 32,000+ readers in our community.
👉 New Tool Alert! NaviPlan: A Privacy-Focused Multi-asset Tracker and Goal Planner 👈
We will then compare these figures with those obtained from an analysis of the cost inflation index.
I have calculated this with a simple CAGR formula:
price in May 2014 = price in Jan 1995 x (1+ inflation)^(time elapsed)
Therefore,
Inflation = (price in May 2014 / price in Jan 1995)^(1/time-elased) -1
The time elapsed is in years – 19.34 in this case
In 1995, we were a family of three. Mom and dad were working and I was in B. Sc final year. In 2014, we are a family of 3 adults (self, spouse, mom) and my four year son.
I have assumed that consumption and nature of expenses have remained the same.
This is debatable but just about reasonable in our case as we have always been pretty frugal.
Some expenses have disappeared – video rentals, and new ones have cropped up – internet usage. TV viewing was high in 1995, computer(s) usage is high in 2014 (with near zero TV). We have one AC now.
So for calculating inflation in electricity I have subtracted Rs. 1000 from today’s fee.
So here goes,

Our flat is a small one, just 9 houses. So maintenance inflation is pretty low. It is an old building with no car park or elevator.
Provisions have more or less remained the same, except for olive oil usage. More on that here.
Cable TV. This again is low. We don’t watch TV at all. Have a slim CRT set kept in one corner of our hall. No HD subscription. Just a bouquet with a reasonable number of channels.
Milk consumption has been the same. We drink a lot of coffee though!
Cooking gas consumption the same. This is important as global factors play a role on this and petrol expenses.
Coming to which, petrol expenses surprisingly same! By dad drove a two wheeler in 95. I do so now. My wife has one, which she barely uses.
Electricity in Tamil Nadu has become quite expensive now. Service has increased tremendously but supply is poor and available only at a premium.
We never had a problem paying a good salary to our paid-help. Inflation affects them too – much, much more.
Look at that vegetable inflation! This is a cause for concern as it depends on monsoons – El Nino! We never use onions too much!
The overall inflation obtained with total expenses is a relatively comfortable 7.8%
What can we infer from these numbers?
We need to use at least 8% inflation in our retirement and financial goal planning calculations. Note that 8% is for a frugal family with practically no entertainment expenses!
What a minute! By using a CAGR formula, I have completed ignored fluctuations in inflation.
When returns fluctuate, they make sense only if we know the corresponding standard deviation.
So we will need to study the fluctuations in inflation to get an idea about what standard deviation to use.
For this, we will use cost inflation index. There is a lot of debate about how the CII is not a good enough tool to represent inflation.
Now that we have some real inflation figures, let us find out, how good CII is in reflecting household inflation.
CII Analysis
Using cost inflation index data from here, the rolling CAGR was calculated for durations ranging from 1 year to 26 years.
CII is set to 100 for FY 1981-82. So if we wish to calculate CAGR for every 1Y period from then to FY 2013-14, we will have 32 data points, which we will average.
Similarly, if we wish to calculate CAGR for every possible 26 year durations, we will have 7 data points, which we will average. Let me know if you need the corresponding Excel file.
This average of the rolling CAGR and the corresponding standard deviation (measure of deviation from the average) is plotted as a function of duration.
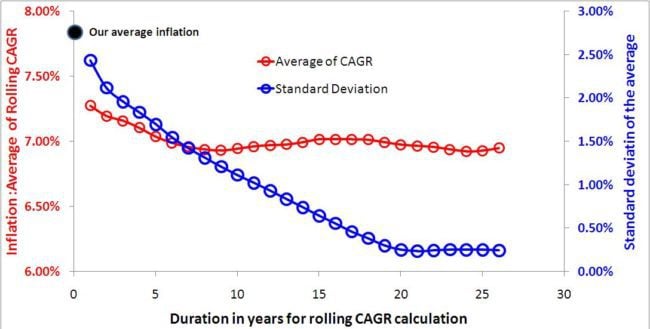
Surprisingly, the average rolling CAGR depends little on the durations. It is about ~ 7.25% whether you the duration is 1Y or 26Y.
Unsurprisingly, the standard deviation sharply decreases and tends to ~ 0.25% with an increase in the duration.
What does this tell us?
- For long term goals, a minimum inflation of 7% should be used, 8% would be better.
- On a year on year basis, average inflation is ~ 7% but can fluctuation as much as 2.5%. That is 68 times out of 100, it can range from 7- 2.5 = 4.5% to 7+ 2.5 = 9.5%.
- This is important for early retirees. This kind of fluctuations implies that the net portfolio return after taxes must be at least 8% if not more for early retirement. Easier said than done with volatile asset classes like equity and bonds.
- This is of course the overall inflation. Inflation for different commodities and different services can deviate from this average significantly.
- Do not take comfort in the 7% average. Always keep in mind that the actual overall inflation can swing from this by as much as 2.5%. Could be more as this is only an approximation!
- Even for a frugal family like us, the overall inflation is 7.8% -. This is much higher than the average of the rolling CAGR.
- Therefore, unless a family cuts down on unnecessary expenditure, it will be difficult for them to handle retirement. Remember to beware of you!
Most families keep a record of budgets past. If you can locate yours, calculate the long-term inflation rate. It will give you a better perspective on retirement planning and goal-planning in general.