Last Updated on October 26, 2020 at 8:57 am
Excel’s IRR and XIRR functions are often used to calculate the rate of investment returns. In this post, let us discuss the limitations of XIRR and IRR functions.
Credit: This discussion is inspired by financial planner Mr. Hari who posted a video describing the limitations of IRR and XIRR on my XIRR calculator page. The video (a must watch for finance professionals) is linked below.
A couple of weeks ago, when the Chit fund returns calculator was published, I had mentioned that, for any investment, if the amount invested is less than the amount received, it might not be possible to calculate the rate of return.
Excels XIRR and IRR functions, or any other code for that matter, cannot handle such situations because there is more than one rate of return possible!
🔥Secure your future with our Robo-advisory tool trusted by over 3,500 investors and advisors. From effortless retirement planning to funding your children’s biggest dreams, turn your financial goals into reality. 🔥
Subscribe for money management solutions via email! (Link takes you to our email sign-up form) Join 32,000+ readers in our community.
👉 New Tool Alert! NaviPlan: A Privacy-Focused Multi-asset Tracker and Goal Planner 👈
In order to understand what this means, let us review some basic definitions.
Cash flow: For the purposes of this post, we define cash flow as receipts – payments.
So if you make a profit in any investment the cash flow is positive and if you incur a loss, the cash flow is negative.
IRR: IRR or internal rate of return is a function in Excel used to calculate the return for any periodic cash flow entries. For example, if you pay insurance premium for 12 months and receive some cash back in the 13th month, you could calculate the monthly IRR and then convert to a CAGR (compounded annual growth rate)
XIRR: If the cash flow entries are not periodic, then XIRR may be used to compute CAGR straightaway using the dates of payments and receipts.
Both IRR and XIRR are approximation methods (we will see why this is necessary below). Therefore, you may have to help them out buy entering a guess for the return.
Let us start a simple situation.
Lump sum investment
Suppose I invest Rs. 100 for 5 years and get Rs. 150 at the end of 5 years, what is the rate of return?
To determine this, we calculate
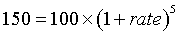
Compound Interest Formula
Here, rate is the rate of return we need to calculate. First, we rewrite
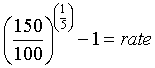
That is, we can pull the rate to one side of the equation.
When this is possible, we can always determine the rate uniquely. That is, there will only be one answer.
SIP investment
Suppose I run a monthly SIP of Rs. 1000 for 5 years and obtain a corpus of say, Rs. 70,000, what is the rate of return?
In this case, the formula gets a bit complicated!


Here, 12000 is the annual investment. Unfortunately, in this case the rate cannot be pulled to one side of the equation.
- Therefore, we have to estimate the rate of returns and cannot determine it as mentioned in my post on generating MF account statement with returns
- Therefore, we need to estimate the returns from a SIP as mentioned in post on SIP account statement from NAV history
To do this, let us first denote

Here f(rate) simply means a quantity which depends on the rate.
We can now write the SIP formula as
C – f(rate) =0
Here C is the corpus accumulated (Rs. 70, 000 in our example). Now we start guessing the rate.
- If our guess is incorrect, C – f(rate) ≠ 0
- If our guess if correct, C – f(rate) =0
Suppose I draw a graph between C – f(rate) versus all possible reasonable for the rate (say between -100% and +100%) then we might get something like this.
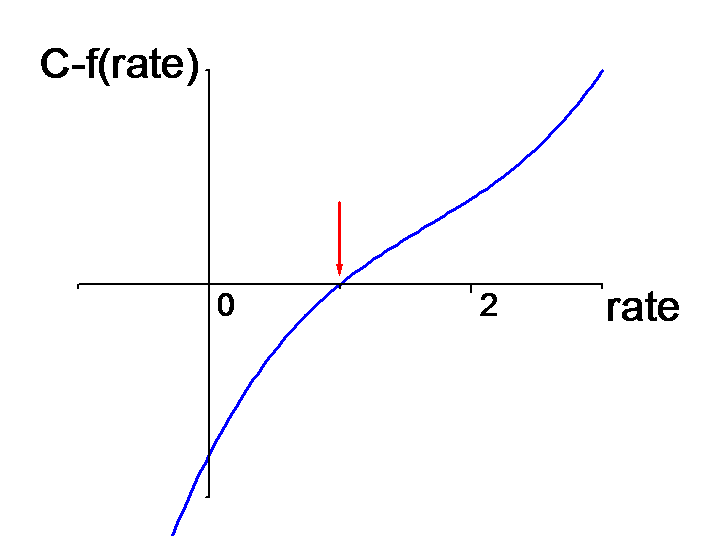
Notice that curve cuts the x-axis at only point. At this point the value of the y-axis is zero (that is C – f(rate) =0).
The corresponding value of the x-axis is the rate of return.
While this is a simple graphical way of calculating the return, there are many mathematical methods to calculate return. Excel’s IRR and XIRR uses a method known as Newton –Raphson method. Here is an excellent review on the subject (strongly recommend resource for all finance professionals)
Calculating rate using such methods work fine, provided the cash flow is positive. That is receipts should be greater than payments.
When the cash flow becomes negative (loss in investment) and in particular a large negative number (huge loss), the plot between C – f(rate) versus rate may look like this.
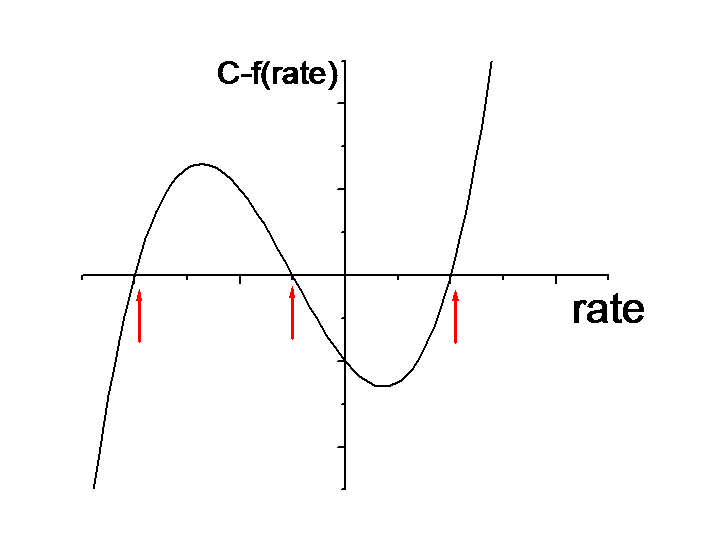
Notice that the curve intersects the x-axis at three points. This means that there are 3 solutions. That is three different rates correspond to our cash flow entries.
Many find this impossible to believe. Unfortunately, this is not only possible but also quite natural.
If we knew what the three solutions are, we could check them using Excels XNPV function. This function returns a value of zero if the right rate of return is chosen. XPNV will be zero for all possible solutions!
Next week I will post an Excel tool by which we can determine all possible solutions for a given cash flow statement.
Video mentioned above
A look at Excel’s XIRR function
If you read the comments below the video, you may notice that I had an interesting discussion with the author.
Bottomline:
- When the investment loss is huge, multiple rate of returns is possible.
- All such solutions are equally correct
- You cannot pick and choose a solution that you like!
- Typically, for such situations, IRR and XIRR will return an error.
- An error is better because, for some situations IRR and XIRR can produce one of the many possible solutions! This is unfortunate because the user believes the answer without realizing that the result is wrong!
The solution: Do not lose money! That way the cash flow is positive and the return will always be unique. Excels IRR and XIRR are then dependable!
Your view: Do spare a moment to let me know if you were able to follow the discussion. What do you make out of all this? If you can add to this discussion in any way, please let me know.