Last Updated on December 29, 2021 at 5:23 pm
Direct plans in which no commissions are removed daily from the NAV along with expenses (prior to publication) were introduced on 1st Jan 2013. This is how a seven-year SIP and a seven-year lump sum in the direct plan and regular plan of the same mutual fund have fared from 1st Jan 2013 to Feb 28th 2020. Please share this article with investors who are still holding regular plans.
It must be made clear to the reader that the primary reason to shift from regular plans to direct plans is to avoid conflict of interest. For the DIY investor, the lower cost over the long term is a no-brainer.
Distributors have been trying all sorts of tricks to prevent investors from redeeming from regulars plans. Some claim that since the direct plan is higher it will result in lower no of units purchased. This myth has been busted before (so will this data): Direct Mutual Fund NAV is higher so Investors will get fewer units: Is this bad?
Join 32,000+ readers and get free money management solutions delivered to your inbox! Subscribe to get posts via email! (Link takes you to our email sign-up form)
🔥Want to create a complete financial plan? Learn goal-based investing? Exclusive access to our DIY tools? Increase your income with your skills? Enjoy massive discounts on our robo-advisory tool & courses! 🔥
Another misinformation used to prevent exit is, “SEBI has said direct plans are only for knowledgeable investors”. This is similar to how insurance agents and employees try to dissuade policy surrenders. I am fairly sure freefincal readers will have such colourful stories to share. Please do in the comments section below.
Investors harassed by distributors should complain to SEBI via their SCORES portal. Note: investors need not inform their distributors before switching out. AMC staff would say this to stop you, but this is wrong.
Those who want assistance may pay a flat fee (not a fee linked to amount invested)) to a SEBI Registered fee-only Investment Advisor. Note a fee-only financial planning is a holistic service including goal-planning, tax-planning, insurance (life/health) and estate planning (will creation, trust creation etc). So please do not compare “fees” of a fee-only with a distributor. It makes even lesser sense to compare the fees of a fee-only planner and a fee-based (fees + commissions).
This report is for those still investing in regular plans. They can pull out some money from regular funds before March 31st (up to one lakh capital gains overall is tax-free for equity, equity mutual funds). Another shift can be made be in April 2020.
For this study, we shall consider 106 large cap, large and midcap, multicap, midcap and smallcap funds in existence on or before 1st Jan 2013. Return (XIRR) from a Rs. 1000 monthly SIP from 1st Jan 2013 is considered.
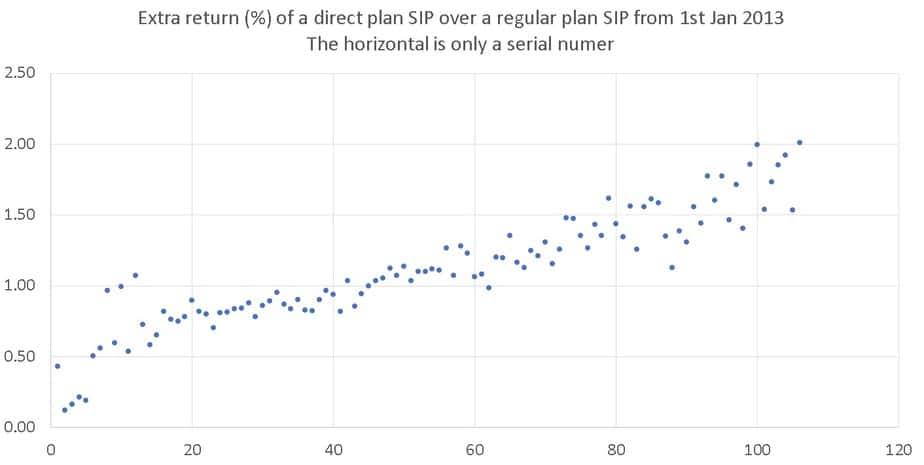
The difference in XIRR of a SIP started on 1st Jan 2013 in a direct plan and regular plan is shown below. The horizontal axis is only a serial number. Note that the XIRR has not been arranged in ascending or descending order.

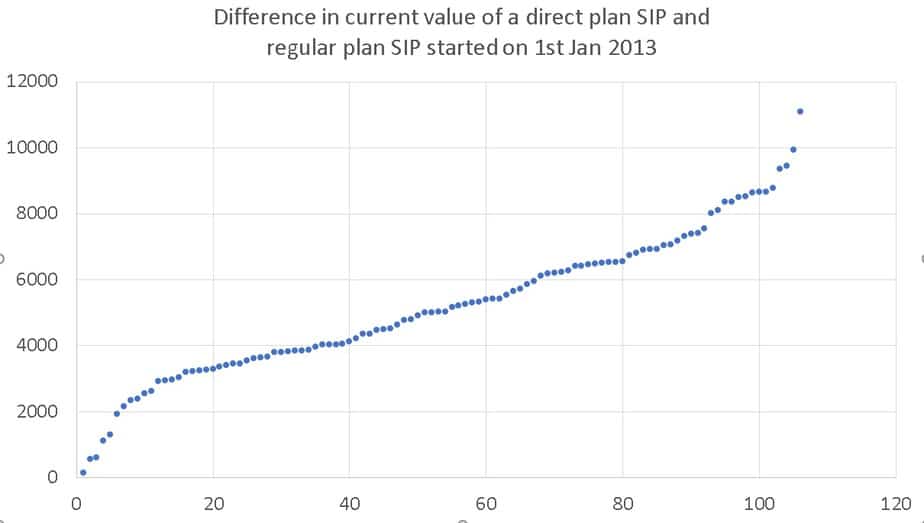
The difference in value as on Feb 29th 2020 ranges from 138 to 11,000 for a monthly Rs. 1000 investment. If the AMCs had not tinkered with direct plan expense ratios frequently, the difference could have been significantly more!
See for example: 48% increase in expense ratio of Birla Reg Savings Fund! Time for SEBI to act?

The highest difference in XIRR (top 25)
| Fund Name | XIRR Difference % |
| Essel Large Cap Equity Fund | 1.56 |
| Principal Emerging Bluechip Fund | 1.26 |
| PGIM India Large Cap Fund | 1.56 |
| Sahara Power & Natural Resources Fund | 1.61 |
| IDFC Core Equity Fund | 1.58 |
| Edelweiss Mid Cap Fund | 1.35 |
| Mirae Asset Emerging Bluechip | 1.13 |
| Axis Bluechip Fund | 1.38 |
| Nippon India Small Cap Fund | 1.31 |
| Tata Large & Mid Cap Fund | 1.56 |
| Sahara Midcap Fund-Auto Payout | 1.44 |
| Indiabulls Blue Chip Fund | 1.78 |
| Kotak Small Cap Fund | 1.60 |
| BNP Paribas Multi Cap Fund | 1.77 |
| Axis Midcap Fund | 1.46 |
| BNP Paribas Mid Cap Fund | 1.71 |
| Canara Rob Emerg Equities Fund | 1.40 |
| Invesco India Largecap Fund | 1.86 |
| Sahara Growth Fund | 2.00 |
| Kotak Emerging Equity Fund | 1.54 |
| Invesco India Growth Opp Fund | 1.73 |
| Invesco India Multicap Fund | 1.85 |
| Sahara R.E.A.L Fund | 1.92 |
| SBI Small Cap Fund | 1.53 |
| Invesco India Midcap Fund | 2.01 |
The lowest difference in XIRR (bottom 25)
| Fund Name | XIRR Difference % |
| Quant Mid Cap Fund | 0.43 |
| Quant Small Cap Fund | 0.12 |
| HDFC Growth Opp Fund | 0.16 |
| Quant Active Fund | 0.21 |
| Quant Large & Mid Cap Fund | 0.19 |
| Taurus Starshare (Multi Cap) Fund | 0.50 |
| UTI Core Equity Fund | 0.56 |
| Edelweiss Large Cap Fund | 0.96 |
| Sahara Wealth Plus Fund-Fixed Pricing | 0.60 |
| Sundaram Large and Mid Cap Fund | 0.99 |
| UTI Equity Fund | 0.54 |
| SBI Magnum Multicap Fund | 1.07 |
| Nippon India Vision Fund | 0.72 |
| Taurus Discovery (Midcap) Fund | 0.58 |
| Sahara Star Value Fund | 0.65 |
| Taurus Largecap Equity Fund | 0.82 |
| HDFC Top 100 Fund | 0.76 |
| DSP Top 100 Equity Fund | 0.75 |
| Union Multi Cap Fund | 0.78 |
| Baroda Mid-cap Fund | 0.90 |
| LIC MF Multi Cap Fund | 0.82 |
| Baroda Large Cap Fund | 0.80 |
| SBI Large & Midcap Fund | 0.70 |
| L&T Equity Fund | 0.81 |
| Sundaram Small Cap Fund | 0.81 |
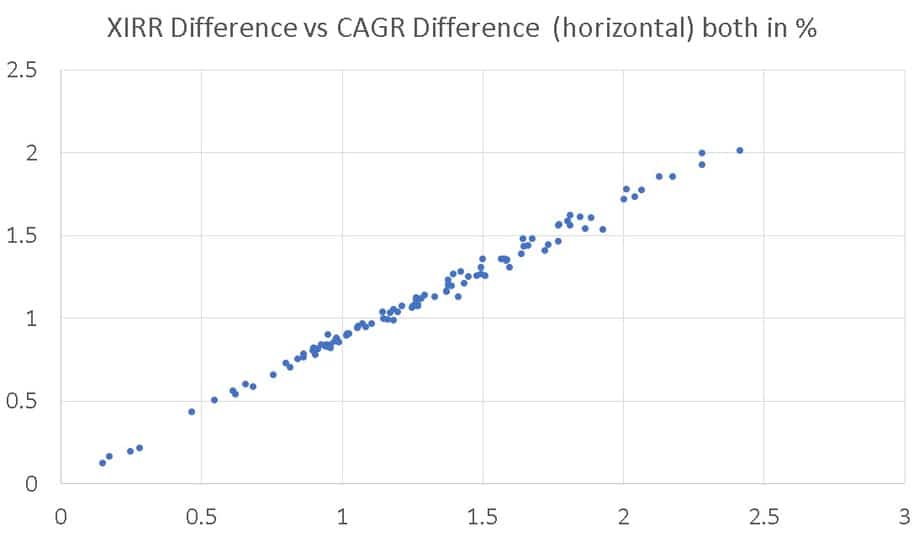
Returns for a lump sum invested on 1st Jan 2013 (CAGR) versus the SIP XIRR is plotted below. The near-linear trend is hardly surprising as commissions for the regular plan are removed each business day.

This article has merely quantified the obvious. Time to wake up, smell the coffee and redeem from regular funds.
🔥Enjoy massive discounts on our courses, robo-advisory tool and exclusive investor circle! 🔥& join our community of 7000+ users!
Use our Robo-advisory Tool for a start-to-finish financial plan! ⇐ More than 2,500 investors and advisors use this!
Track your mutual funds and stock investments with this Google Sheet!
We also publish monthly equity mutual funds, debt and hybrid mutual funds, index funds and ETF screeners and momentum, low-volatility stock screeners.


- Do you have a comment about the above article? Reach out to us on Twitter: @freefincal or @pattufreefincal
- Have a question? Subscribe to our newsletter using the form below.
- Hit 'reply' to any email from us! We do not offer personalized investment advice. We can write a detailed article without mentioning your name if you have a generic question.
Join 32,000+ readers and get free money management solutions delivered to your inbox! Subscribe to get posts via email! (Link takes you to our email sign-up form)
About The Author
 Dr M. Pattabiraman(PhD) is the founder, managing editor and primary author of freefincal. He is an associate professor at the Indian Institute of Technology, Madras. He has over ten years of experience publishing news analysis, research and financial product development. Connect with him via Twitter(X), Linkedin, or YouTube. Pattabiraman has co-authored three print books: (1) You can be rich too with goal-based investing (CNBC TV18) for DIY investors. (2) Gamechanger for young earners. (3) Chinchu Gets a Superpower! for kids. He has also written seven other free e-books on various money management topics. He is a patron and co-founder of “Fee-only India,” an organisation promoting unbiased, commission-free investment advice.
Our flagship course! Learn to manage your portfolio like a pro to achieve your goals regardless of market conditions! ⇐ More than 3,000 investors and advisors are part of our exclusive community! Get clarity on how to plan for your goals and achieve the necessary corpus no matter the market condition is!! Watch the first lecture for free! One-time payment! No recurring fees! Life-long access to videos! Reduce fear, uncertainty and doubt while investing! Learn how to plan for your goals before and after retirement with confidence.
Our new course! Increase your income by getting people to pay for your skills! ⇐ More than 700 salaried employees, entrepreneurs and financial advisors are part of our exclusive community! Learn how to get people to pay for your skills! Whether you are a professional or small business owner who wants more clients via online visibility or a salaried person wanting a side income or passive income, we will show you how to achieve this by showcasing your skills and building a community that trusts and pays you! (watch 1st lecture for free). One-time payment! No recurring fees! Life-long access to videos!
Our new book for kids: “Chinchu Gets a Superpower!” is now available!


Must-read book even for adults! This is something that every parent should teach their kids right from their young age. The importance of money management and decision making based on their wants and needs. Very nicely written in simple terms. - Arun.Buy the book: Chinchu gets a superpower for your child!
How to profit from content writing: Our new ebook is for those interested in getting side income via content writing. It is available at a 50% discount for Rs. 500 only!
Do you want to check if the market is overvalued or undervalued? Use our market valuation tool (it will work with any index!), or get the Tactical Buy/Sell timing tool!
We publish monthly mutual fund screeners and momentum, low-volatility stock screeners.
About freefincal & its content policy. Freefincal is a News Media Organization dedicated to providing original analysis, reports, reviews and insights on mutual funds, stocks, investing, retirement and personal finance developments. We do so without conflict of interest and bias. Follow us on Google News. Freefincal serves more than three million readers a year (5 million page views) with articles based only on factual information and detailed analysis by its authors. All statements made will be verified with credible and knowledgeable sources before publication. Freefincal does not publish paid articles, promotions, PR, satire or opinions without data. All opinions will be inferences backed by verifiable, reproducible evidence/data. Contact information: To get in touch, use this contact form. (Sponsored posts or paid collaborations will not be entertained.)
Connect with us on social media
- Twitter @freefincal
- Subscribe to our YouTube Videos
- Posts feed via Feedburner.
Our publications
You Can Be Rich Too with Goal-Based Investing
 Published by CNBC TV18, this book is meant to help you ask the right questions and seek the correct answers, and since it comes with nine online calculators, you can also create custom solutions for your lifestyle! Get it now.
Gamechanger: Forget Startups, Join Corporate & Still Live the Rich Life You Want
 This book is meant for young earners to get their basics right from day one! It will also help you travel to exotic places at a low cost! Get it or gift it to a young earner.
Your Ultimate Guide to Travel
 This is an in-depth dive into vacation planning, finding cheap flights, budget accommodation, what to do when travelling, and how travelling slowly is better financially and psychologically, with links to the web pages and hand-holding at every step. Get the pdf for Rs 300 (instant download)