Last Updated on December 29, 2021 at 5:03 pm
Do you want mutual funds that have got a higher return than a benchmark at lower risk? Then here is an easy way to spot them!
In order to do this, let us first define “return”. This is easy, we will just use the annualized return aka compounded annualized growth rate (CAGR) aka IRR aka XIRR. Then we define “risk”.
Unlike return, risk can be defined in many ways. The simplest and most common measure of risk is the standard deviation. We look at a mutual fund’s daily returns and determine how much they deviate from the average daily return over say a year or three years. This tells us how volatile the fund is.
🔥Secure your future with our Robo-advisory tool trusted by over 3,500 investors and advisors. From effortless retirement planning to funding your children’s biggest dreams, turn your financial goals into reality. 🔥
Subscribe for money management solutions via email! (Link takes you to our email sign-up form) Join 32,000+ readers in our community.
👉 New Tool Alert! NaviPlan: A Privacy-Focused Multi-asset Tracker and Goal Planner 👈
So we shall define a fund with lower risk as one with a lower standard deviation than a benchmark. That is lower volatility than a benchmark. We shall define a fund with higher return as one with a higher return than a benchmark (obviously!)
The question now is, how do we screen for funds with lower risk and higher returns. First, we need to decide on the duration. How about funds with lower risk and higher returns over the last 1,2,3,4 and 5 years? That is a reasonably robust filter. The goal with any screening is to reduce the number of funds, but it should not reduce it down to one or two funds as such a list will be too variable. The above conditions get the job done well.
Shortlisting mutual funds with lower risk and higher return
Let us consider the data over the last five years. We have 368 equity funds in the basket, to begin with. We first define the Excess return of the fund = Five-year return of the fund minus the five-year return of the index. So, if the excess return is positive it means the fund has beat the index and vice versa.
Next, we define the Excess risk of the fund = Five-year standard deviation of the fund minus five-year standard deviation of the index. So if the excess risk of the fund is negative it means the fund has taken lower risk than the index and vice versa.
Clearly, we are looking for funds with positive excess return and negative excess risk. Such funds would have beat the benchmark by taking a lower risk. Suppose we plot the excess return (vertical axis) vs the excess risk of all the funds, we would get this.
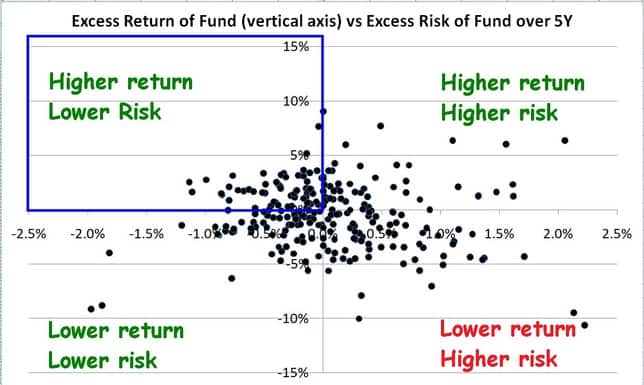
This is however only over five years. We can make this a lot tighter by demanding that funds beat the benchmark at lower risk over 1,2,3,4 and 5 years. For June 2020, this results in only 8 funds across these categories.
| Category | No of qualifying funds |
| Focussed Fund | 1 |
| Large Cap Fund | 2 |
| Multi-Cap Fund | 1 |
| Mid Cap Fund | 4 |
This lower risk, higher reward screening is automatically applied in the freefincal equity mutual fund screener. This is a video guide for using the screener.
To obtain the monthly shortlist of funds with lower risk and higher return, readers may consult our monthly mutual fund screeners (latest would be the first on the list). In addition to the above screening,