Last Updated on August 14, 2017 at 9:36 am
How much can I expect from equity as an asset class for long-term goals?. This is a question one often hears from first-time investors, especially those who are migrating from the comfort of fixed deposits or real estate.
Unfortunately, answers from experienced equity investors are steeped in hindsight bias. They often extrapolate their own good fortune into the future. Answers from salespersons cannot be vague. I have seen advisors state, “invest and after X years you will definitely get Y returns”!
The plain and simple academic fact is: returns can swing so much, that one cannot really expect anything.
That said, as Dr. Uma Shashikant once responded to Swapnil kende’s question on why should equity beat inflation?,
🔥Secure your future with our Robo-advisory tool trusted by over 3,500 investors and advisors. From effortless retirement planning to funding your children’s biggest dreams, turn your financial goals into reality. 🔥
Subscribe for money management solutions via email! (Link takes you to our email sign-up form) Join 32,000+ readers in our community.
👉 New Tool Alert! NaviPlan: A Privacy-Focused Multi-asset Tracker and Goal Planner 👈
business borrow money at rates comparable to inflation. Since a society has certain needs on a day to day basis, businesses cater to those needs. If businesses have to survive, they must profit. Meaning shareholders will get returns higher than the rate of borrowing.
Thus one can say with reasonable certainty, that given enough time, returns from equity will beat inflation. By how much, is something that cannot be said for sure.
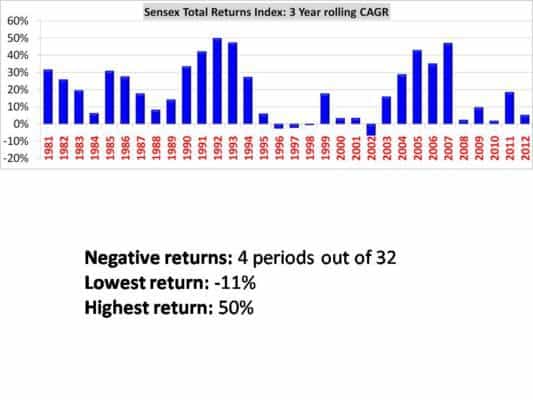
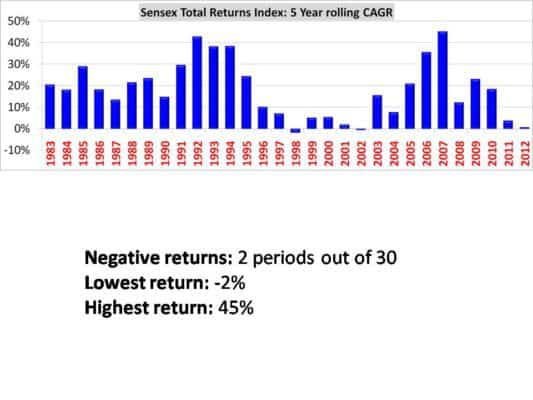
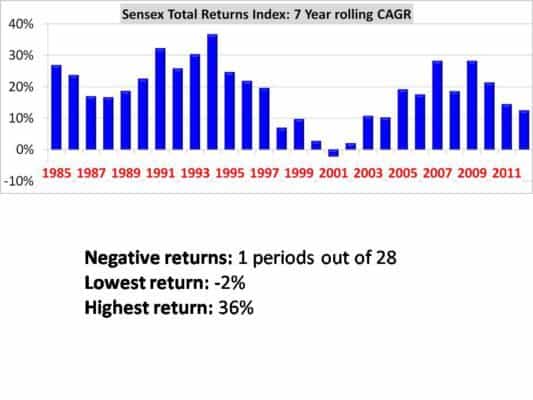
Let us try and answer this the titular question in two parts. First, let us look at rolling CAGR returns of the Sensex total returns index for different durations from 1979 to 2012 (too lazy to add the last two year data points!).
In this post, I do not wish to add much commentary. I request you to please look at the data to get an idea of how much equity return (from large cap stocks) can fluctuate.
In the second part, we shall analyze this data. These are slides that I showed in the Chennai and Bangalore investor meets.
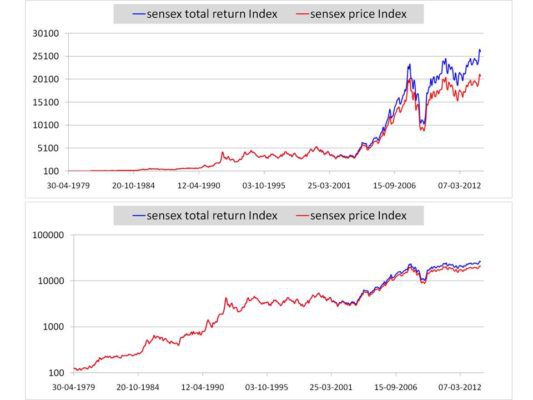
The price index and total returns index in normal and logarithmic scales (below). Notice that market has risen and stayed flat for extended periods. So the returns are typically clumped and not steady. Sequence of returns, matter. A person investing at at the start of a sideways market may have different view of equity than one who started along with the start of a bull run.
Now let us look at the rolling returns for different durations.
3 year rolling CAGR
5 year rolling CAGR
7 year rolling CAGR
10 year rolling CAGR
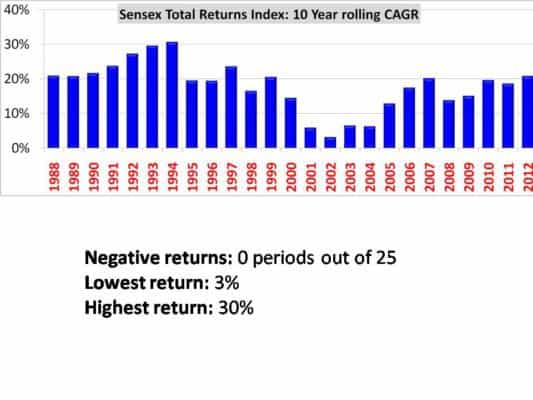
15 year rolling CAGR
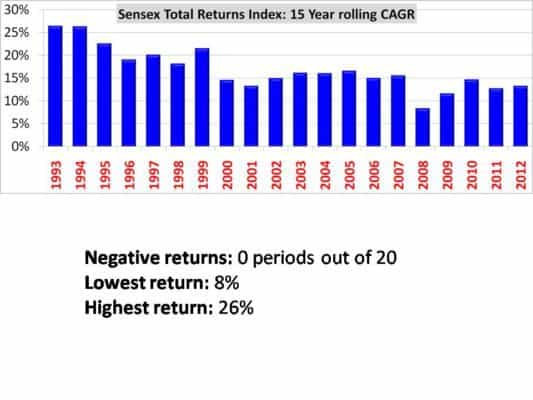
20 year rolling CAGR
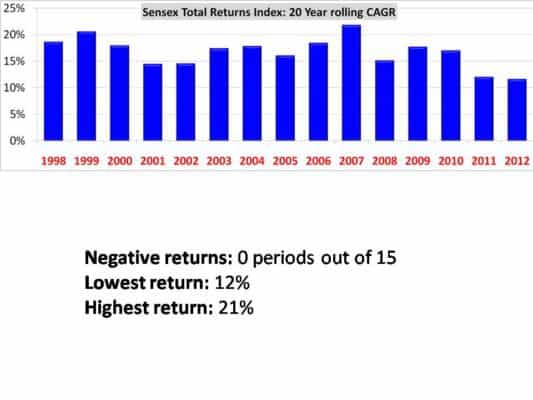
25 year rolling CAGR
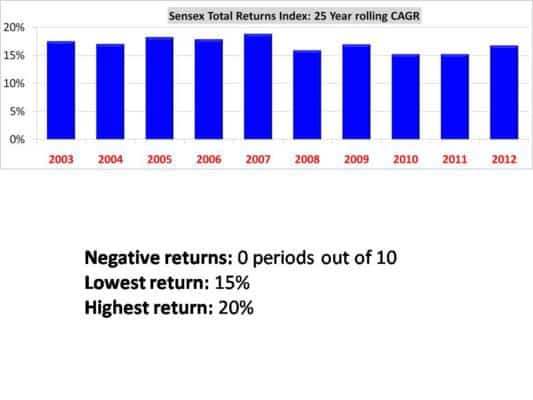
Don’t get fooled by what AMCs and advisors tell you. Zero negative return periods mean nothing. Notice how much the returns can swing (difference between lowest and highest returns) , especially for 10, 15, 20 and 25 year periods.
Based on this data, can you answer:
How much can I expect from equity as an asset class for long-term goals?
We will dig deeper in the second part: What Return Can I Expect From Equity Over the Long-term? Part 2