Last Updated on January 10, 2016 at 7:10 am
In the second part 2, let us address the ‘kitna milega?’ with a little more analysis. The first part is here. Before we being to answer, what return one can expect, the objective of the study must be clear.
We will be using past data to figure out, for a given duration (say 15 years), what is the average return and how much individual returns can deviate from this average.
To what extent this can be done is a big question mark, as explained below. Assuming we can find
- the average return and
- the average deviation from the return
we will have to recognise that the average past return is not of much use. Future returns from equity as an asset class, combined the specific duration an investor will stay in equity implies that the past average has no bearing on the future average.
🔥Secure your future with our Robo-advisory tool trusted by over 3,500 investors and advisors. From effortless retirement planning to funding your children’s biggest dreams, turn your financial goals into reality. 🔥
Subscribe for money management solutions via email! (Link takes you to our email sign-up form) Join 32,000+ readers in our community.
👉 New Tool Alert! NaviPlan: A Privacy-Focused Multi-asset Tracker and Goal Planner 👈
However, 100+ years of US market history and 30+ years of our market history point to one indisputable fact:
regardless of when we measure and regardless of how long we measure it for, the volatility of the market is nearly constant!
To know more about this, read: Understanding the nature of stock market returns
Therefore, although the past average is not be of much use (future returns will depend on inflation, economy …), the past average deviation, or the spread about the average is important.
For example, we shall see below that for 15 year periods, individual returns can vary from the average by as much as 4%. We will understand how to interpret this 4% spread below.
I see no reason to believe that the next 15 years will have a lower spread. It can be higher, but 4% is what I would set as the minimum.
This is the objective of this post. To mentally prepare new equity investors to face the kind of fluctuations that the market has to offer. There is a misconception that things will get better with time. They will not! You need to review the folio at least annually.
The above spread is for a buy-and-hold portfolio. With a simple annual review, it may be possible to minimize this spread.
‘Kitna milega?’, nahi!
‘vichalan kitna hoga?’ (apologies for the poor Hindi. Vichalan is the closest I could find for deviation or spread.)
Instead of vichalan, Harrsh Ankola suggested at Asan Ideas for Wealth that, ‘kita hilega?’ would sound better. I agree.
Now over to the analysis.
The normal distribution
Mathematics is the language of nature and therefore of god (for those who choose to believe in one). If we try to avoid math and use our common tongue, we end up making mistakes or confusing ourselves and others.
One of the most extraordinary manifestations of nature is the so-called normal distribution. If we start measuring the blood pressures of a million people, the distribution of blood pressures would look like this.
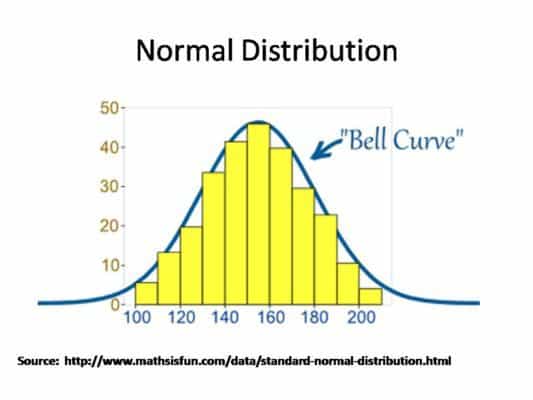
The x-axis would represent different BP ranges (above numbers are random) and the y-axis the probability for each BP range.
The average blood pressure has the highest probability (centre of the peak). Few have a BP higher than average (right of the peak) and few lower than average (left of the peak).
If we measure BP on enough number of people, we will always end up with this kind of distribution.
Most distributions tend to a normal distribution if the number of measurements increases. That is how nature/god works. There are a few exceptions (perfection is a gift that eludes even god!) – the stock market being the most notable!
Perhaps God lost money (like Newton did!) and cursed the markets!
You can google for examples of normal distribution and you will find it in different walks of life. At the IITs we use it to grade large classes, similar to what rating portals try to do.
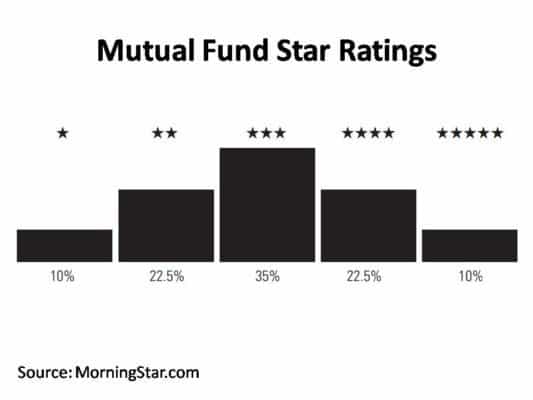
The standard deviation
Assuming a distribution is normal, the standard deviation play a pivotal role. The standard deviation is a measure of how much individual data points can deviation from the average.
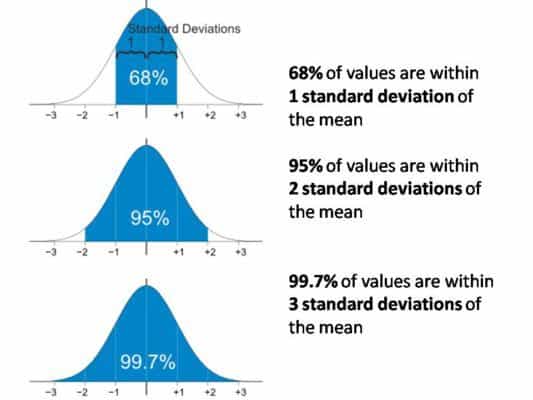
The point is, once I have a normal distribution, I use the mean(average) which is the peak value and the standard deviation in the following way:
Expected value: average+/-standard deviation
Here the expected value refers to expectation up to 68% probability.
Annual returns S&P 500
The X-axis is return range and Y-axis probability of each return bin.
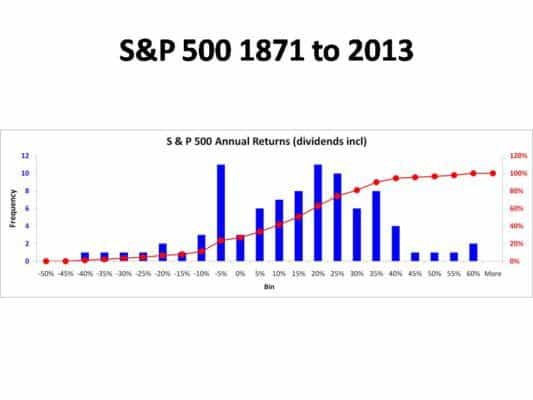
The Notice the absence of symmetry. The red line present the total probability count. You can ignore it.
Such a distribution is known as a skewed distribution.
Sensex Annual Return
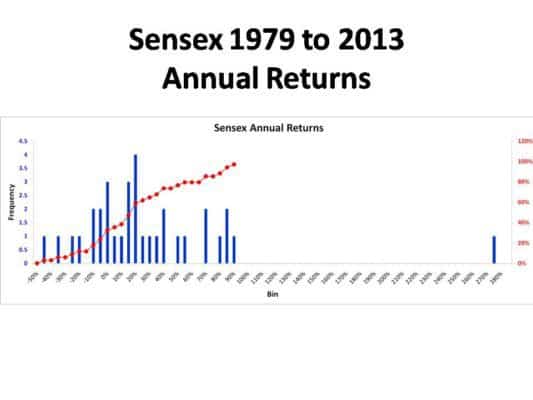
The lone point on the right is due to Mr. Harshad Mehta! Even if we remove that point, the rest of the points are not normal.
15 year CAGR distribution
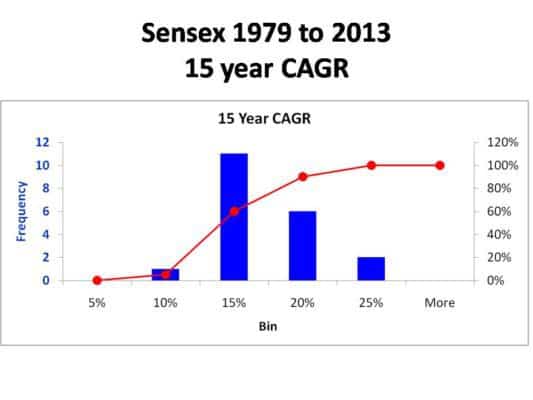
Still not normal and skewed to the right (which is probably a good thing!). In such distribution, the average return is meaningless. Instead of the average or mean, we should use the median. The median divides the distribution into two exact halves.
Fortunately, it is possible to transform a non-normal distribution to a normal distribution by using the square root of the returns instead of the returns.
Square root 15 Y distribution
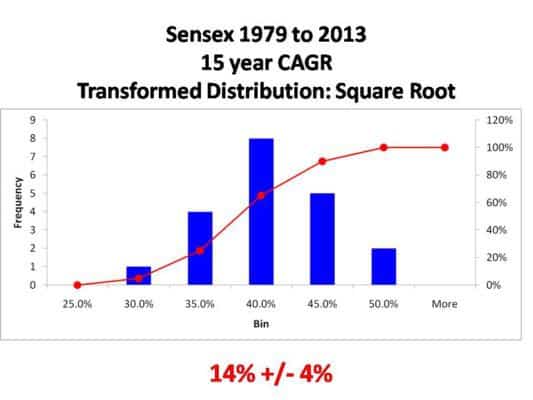
The x-axis here is the square root of the return. Exact values do not matter.
This distribution is not 100% normal but is nearly so. Therefore, the average and standard deviation are reasonable approximations.
Conclusion
Over a 15 year period, Sensex returns in the past (for buy-and-hold) have returned 14% on average, but with a spread of 4%.
That is returns can typically vary from 10% to 18%.
Therefore do not expect too much from equity: 10% is an extremely safe expectation; 12% is reasonable; 14% is borderline okay. Anything above that is nuts!