Last Updated on December 18, 2021 at 10:36 pm
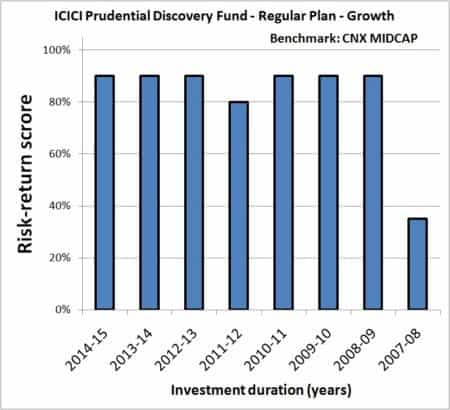
Analyse mutual fund performance on year on year basis for the last 8 years with this tool. This is a modified version of the risk return analyzer where investments durations of 1 to 8 years were considered.
In this version the duration is fixed at 1 year but it is rolled over. That is risk adjusted performance in the
- last year (from last NAV date to 1Y back) Say April 2015 to April 2014
- a year before that, April 2014 to April 2013
- a year before that, April 2013 to April 2012 and so on for 8 durations.
The advantage here is each investment duration is independent of the other. Unfortunately, this is quite a strict method of evaluating funds. It will tell you if the performance has sharply dropped in the recent past (see below), but should you act on it and exit the fund is something that is quite difficult to say. You will need to evaluate the position of the fund in your folio, market conditions, and your own faith in the fund.
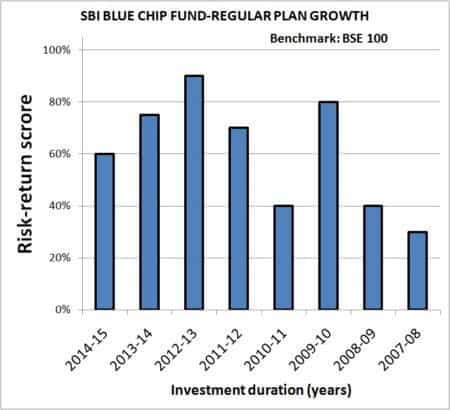
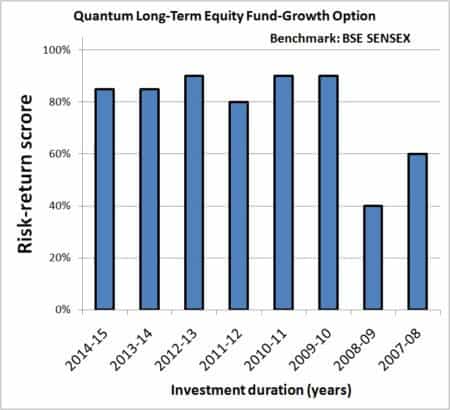
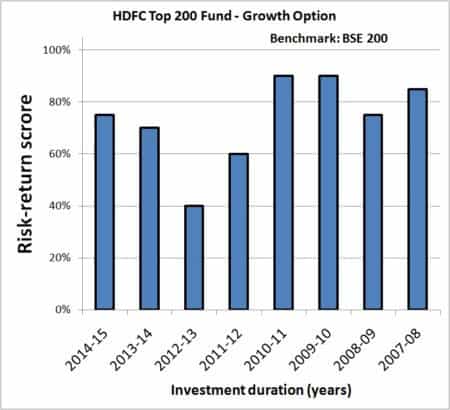
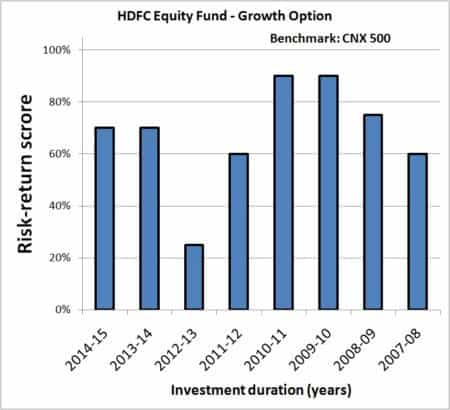
While choosing a fund, it makes sense to use this tool and look for consistent performers. Any fund consistently above a risk-return score (based on 13 unique metrics)of 60% and above should be good enough to buy and hold.
🔥Secure your future with our Robo-advisory tool trusted by over 3,500 investors and advisors. From effortless retirement planning to funding your children’s biggest dreams, turn your financial goals into reality. 🔥
Subscribe for money management solutions via email! (Link takes you to our email sign-up form) Join 32,000+ readers in our community.
👉 New Tool Alert! NaviPlan: A Privacy-Focused Multi-asset Tracker and Goal Planner 👈
All the metric used are defined here
How to use this tool?
If you want to select mutual funds:
- Select category
Go to VR online and short list consistent performers in that category: over 3,5 and 10Y or at least 3 and 5Y.
This is your shortlist.
Check the year on year risk-return score of each fund in your shortlist with this sheet and select one which is consistent. You are done.
There are other sheets like the Ulcer index and upside-downside protection. To learn more about this:
Mutual Fund Analysis With the Ulcer Index
Simplify Mutual Fund Analysis with Upside/Downside Capture Ratios
I have introduced a new sheet called ‘information ratio’. A metric considered important by Dr. Uma Shashikant. More on this later. A simple definition of this ratio is included in the sheet.
Here are some sample results. I will post more soon. Please analyse the following graphs and share your thoughts in the comments section.