
Last Updated on April 26, 2025 at 9:23 pm
The 13th edition of the freefincal stock analyzer now auto-generates Hewitt Heiserman Jr.’s Earnings Power Box, thank to efforts of Rs. Srivatsan, who explained how to identify good business from bad one using it in yesterdays guest post: It’s Earnings That Count: Forget the next Infy; Can you identify the next Satyam? The automated stock analyzer pulls financials from morningstar, stock price history from moneycontrol and calculates intrinsic value in six different ways, along with Dupont analysis, Graham number, Piotroski and Altman Z-scores for financial health.
Update: This tool is now part of the freefincal investor circle.
If you have not read Srivatsan’s post, please do so before reading any further. In order to ensure the calculation is based on data from a single source, Srivatsan has made some reasonable modifications to the formulae mentioned in his post. Although the earnings power box can be generated with data from morningstar in under 20 seconds, the tool is only meant for users who spend a lot longer in studying and interpreting the data.
Like any stock analysis, this tool comes with assumptions and it is important to understand them and change them as per sector or company.
🔥Secure your future with our Robo-advisory tool trusted by over 3,500 investors and advisors. From effortless retirement planning to funding your children’s biggest dreams, turn your financial goals into reality. 🔥
Subscribe for money management solutions via email! (Link takes you to our email sign-up form) Join 32,000+ readers in our community.
👉 New Tool Alert! NaviPlan: A Privacy-Focused Multi-asset Tracker and Goal Planner 👈
Earnings Power Box
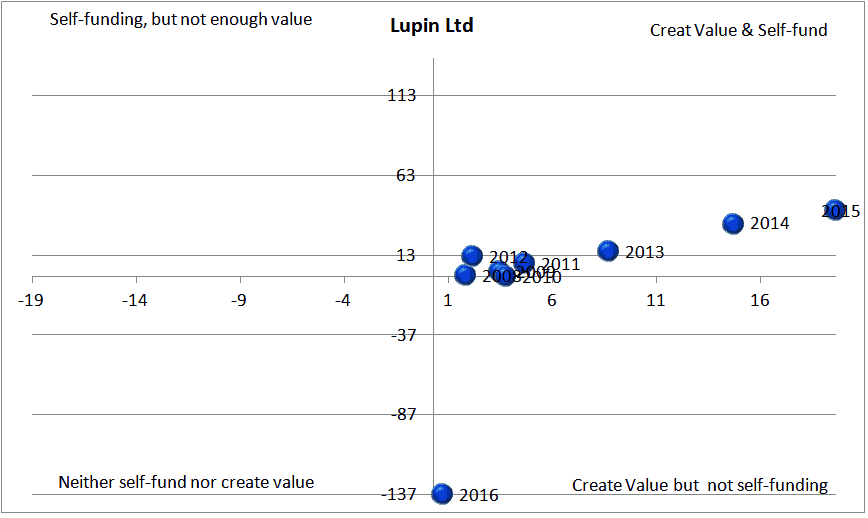
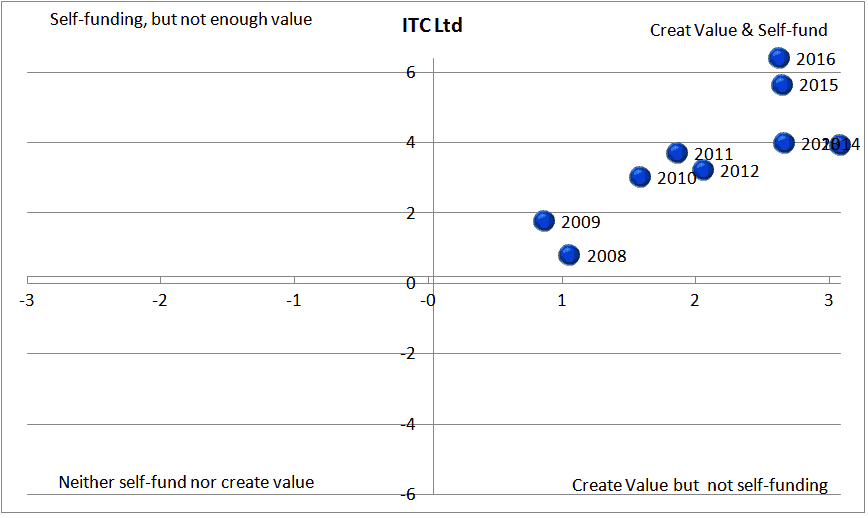
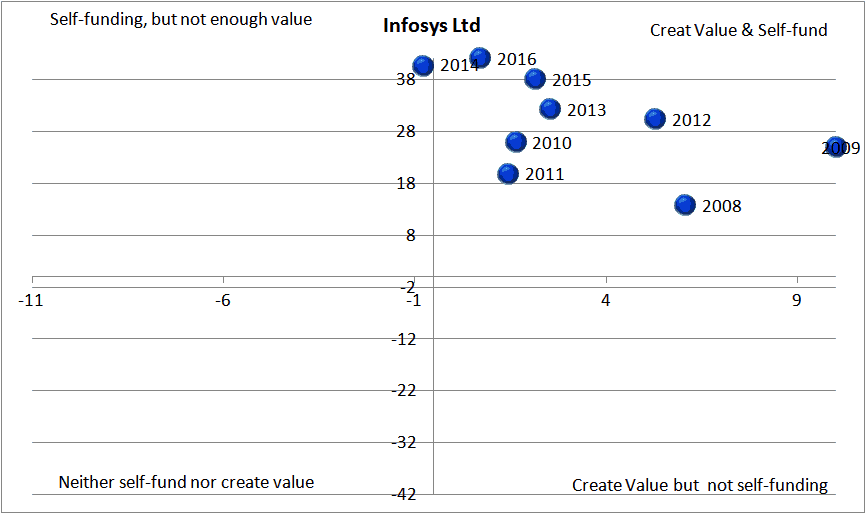
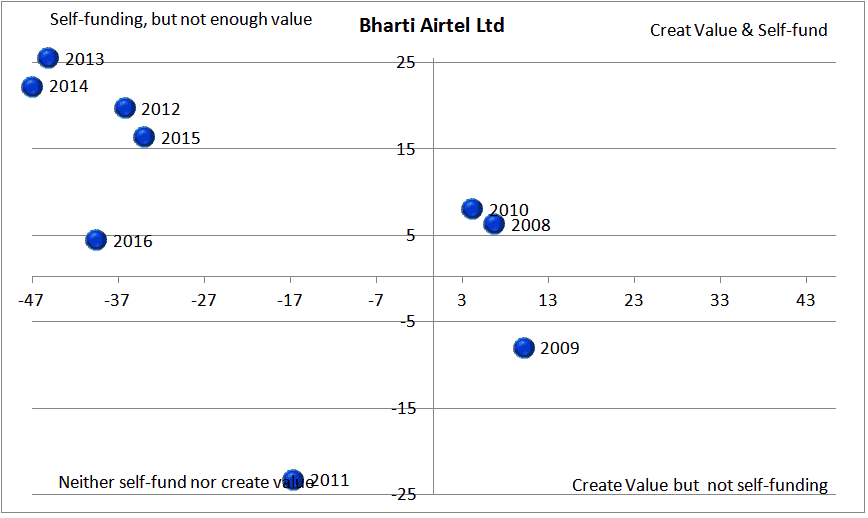
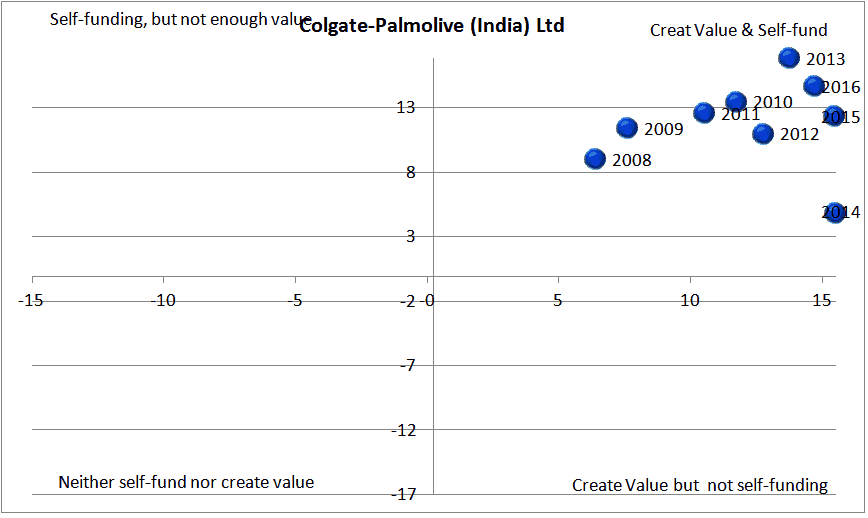
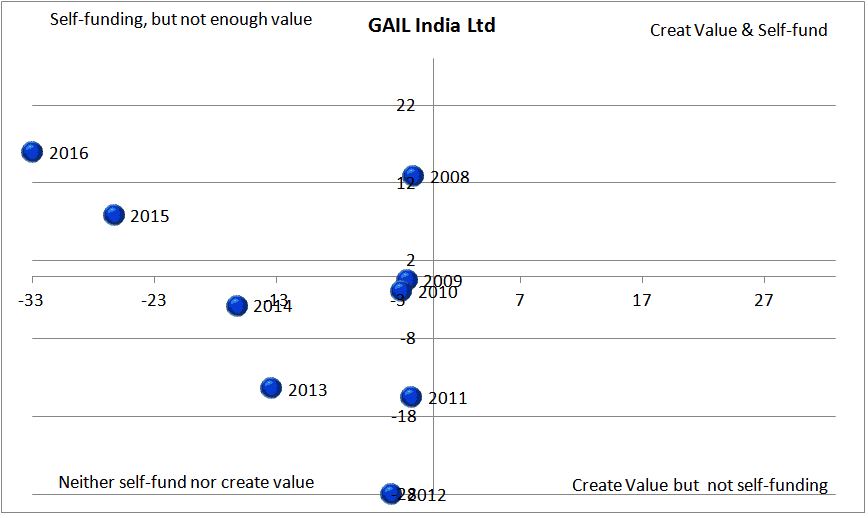
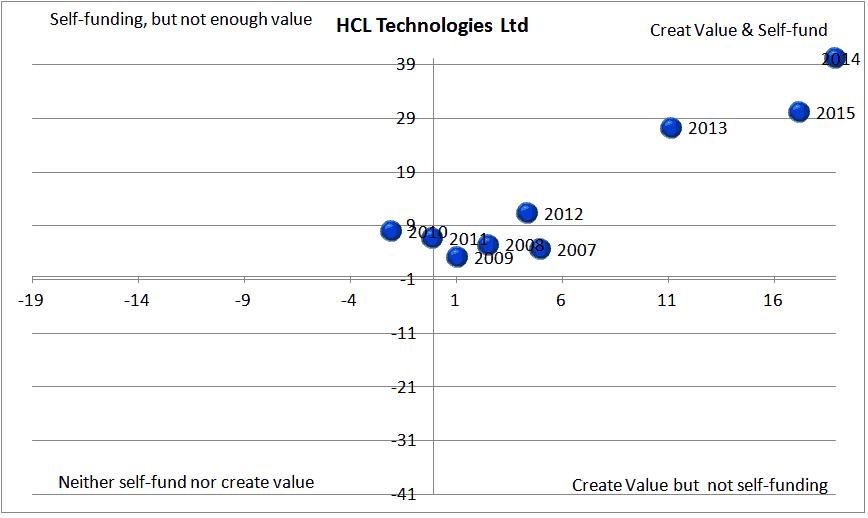
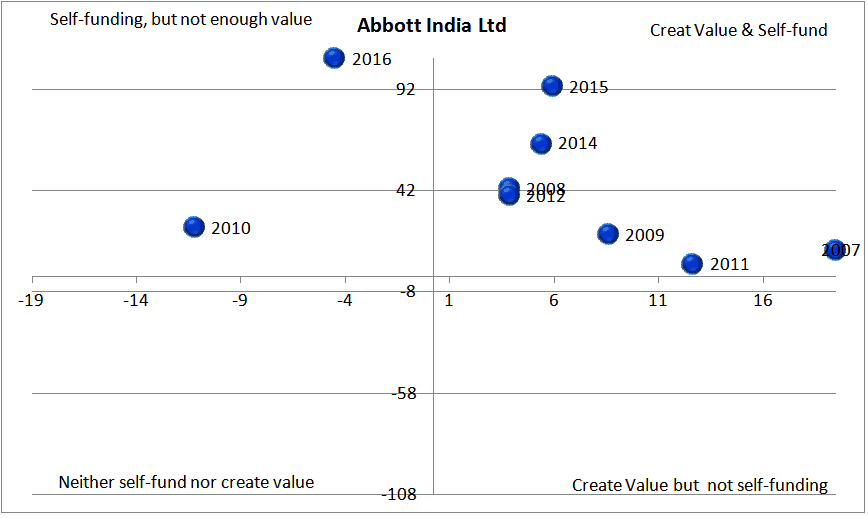
This is a plot of two the Defensive EPS (earnings per share) vs Enterprising EPS
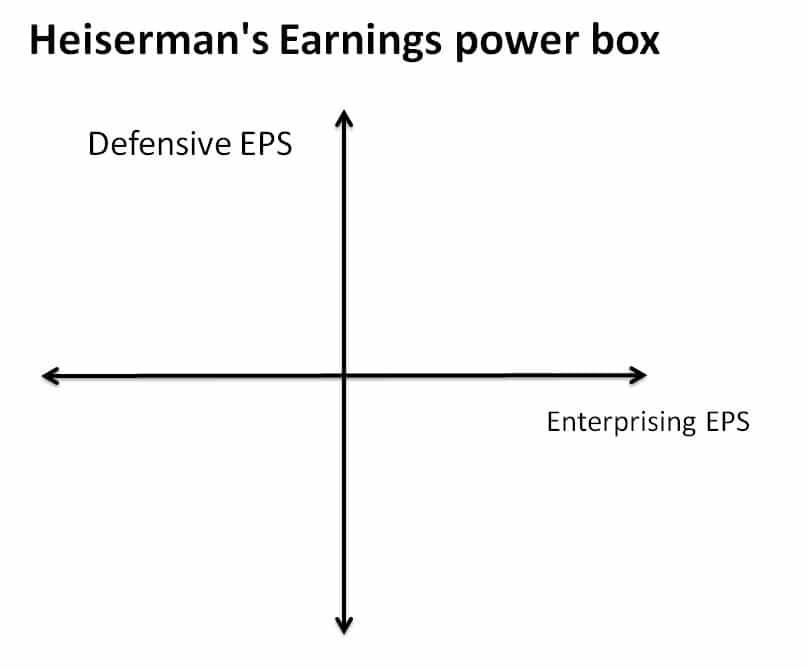
The idea is to spot where a company falls in.
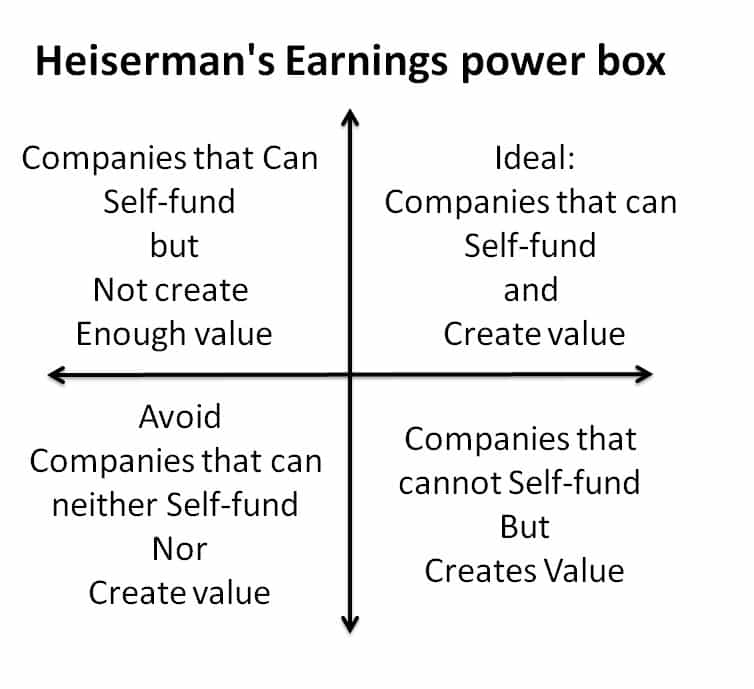
This is based on: Earnings Power Valuation Model (doc file).
Srivatsan has defined enterprising and defensive EPS as follows:
Enterprising EPS = (Enterprising Income)/(Shares Outstanding)
Defensive EPS = (Defensive Income)/(Shares Outstanding)
Enterprising Income = Net Income – (15% x total capital)
15% here is the weighted average cost of capital (WACC) and is an expected return. You can modify this for each FY and for each stock.
15% x total capital = enterprising interest.
Defensive Income = Free Cash Flow – change in working capital since last FY.
Srivatsan will explain more about these assumptions and limitations (everything has them) in a couple of days.
Earnings Power Box Gallery
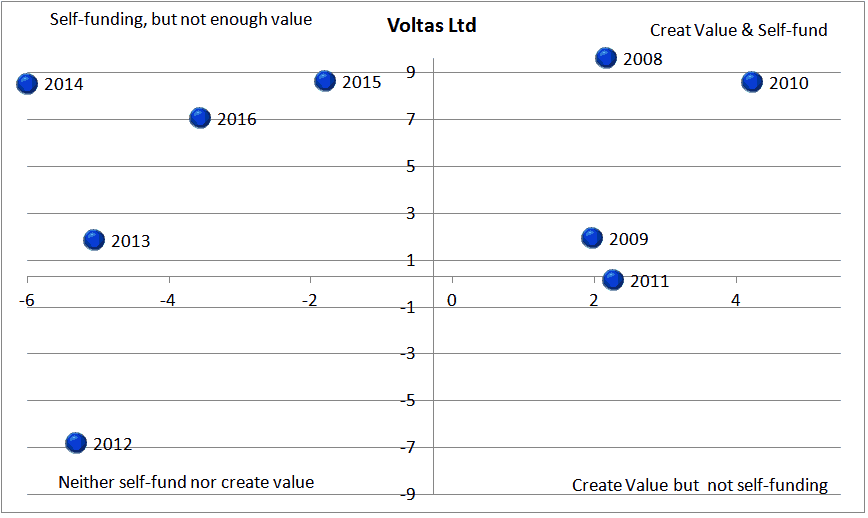
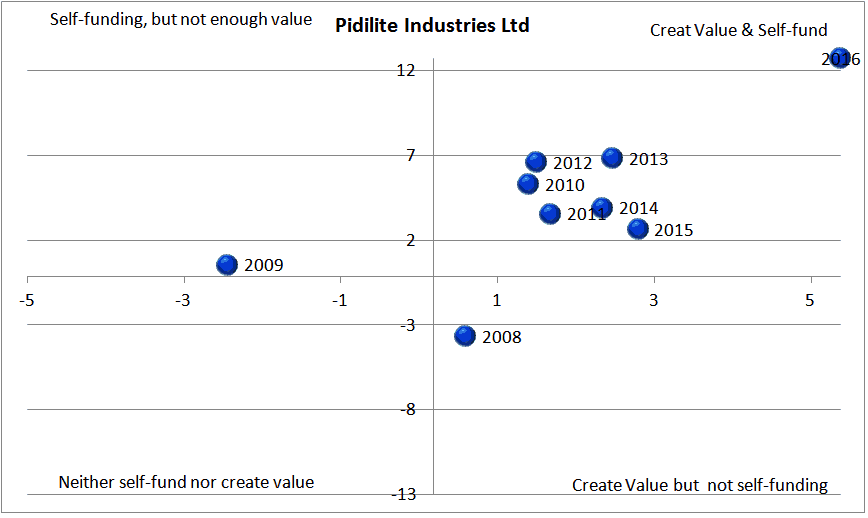
I went crazy and fooled around with the sheet. Here are a few examples. Please remember that this tool is not for those who do not understand what the above definitions stand for. Do not take the graphs on face value. Context matter and always evaluate a stock in multiple ways.




Other Features
The automated stock analysis sheet
- pulls financials from morningstar and analyzes them
- pulls adjusted stock price history from money control, and
- calculates intrinsic value six different ways!
It also pulls annual (standalone/consolidated) and quarterly financials from Value Research online.
Valuation models available:
1) Price Multiple Model
2) Sustainable Growth Rate
3) Book Value Growth Rate (Buffett’s approach to valuation)
4) Discounted Cash Flow(DCF)
5) Reverse DCF Valuation
6) Graham formula and Graham number
7) Piotroski Score for the last 9 financial years
8) Earnings Growth Estimate.
9) Automated Return on Equity Analysis with the Dupont Formula
10) Altman Z-score
This tool is now part of the freefincal investor circle.