Last Updated on October 8, 2023 at 1:42 pm
I discuss ways in which we can visualise and interpret the annualised return, also known as the compounded annualised growth rate or the CAGR and volatility of returns. Franklin India Prima Fund had a NAV of 201.75 on April 3rd, 2006 and a NAV of 878.5 on 12th April 2017. What is the annualised return?
To compute this, we first realise 11 years is the intervening time period – 11.033 to be precise. The annualized return is given by,
878.5 = 201.75 x (1+ CAGR)^11.033
CAGR = (878.5/201.75)^(1/11.033)-1 = 14.26%.
🔥Secure your future with our Robo-advisory tool trusted by over 3,500 investors and advisors. From effortless retirement planning to funding your children’s biggest dreams, turn your financial goals into reality. 🔥
Subscribe for money management solutions via email! (Link takes you to our email sign-up form) Join 32,000+ readers in our community.
👉 New Tool Alert! NaviPlan: A Privacy-Focused Multi-asset Tracker and Goal Planner 👈
Here ^ refers to “the power of” ( eg. 2^4 = 2 x 2 x 2 x 2)
This means that if we treat the mutual fund investment as a fixed income instrument providing annual interest on the account balance then the annual interest is 14.26%.
Of course, any market-related instrument does not provide interest or compound. It grows up or down in value. We make this kind of calculation to compare the “growth” with a risk-free instrument (that does compound) to ascertain the risk premium.
Now, suppose we decide to simulate the NAV growth from April 2006 to 2017, with only the above-mentioned information, then we will have to assume that the NAV grows by the same amount every day, and there are 2709 business days.
So we have,
NAV on April 12th 2017 = (NAV on April 3rd 2006) x (1+R)^2709
R = daily growth rate (I don’t want to call it interest rate!)
R = 0.054%.
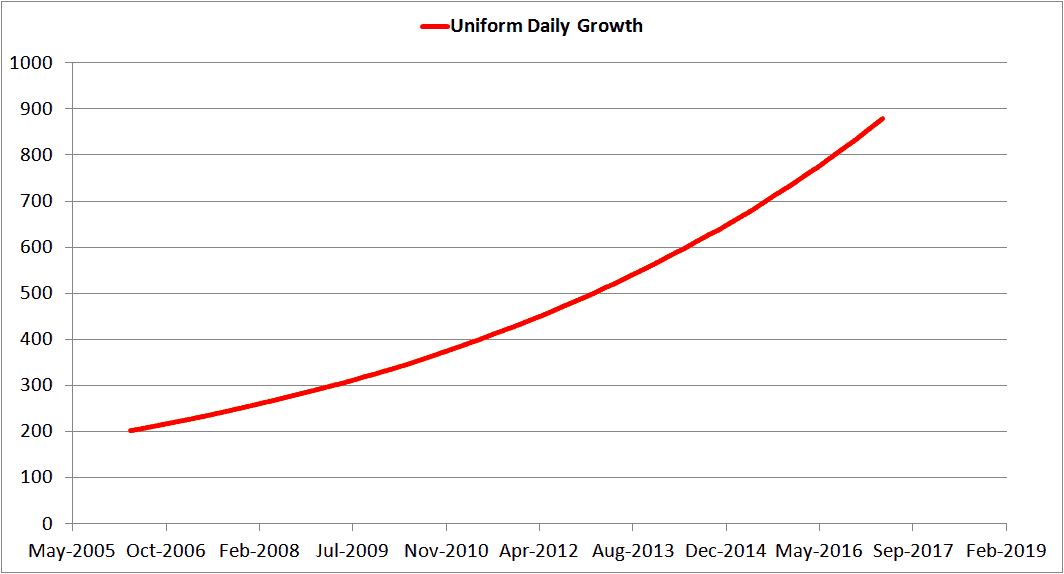
Naturally, this is nonsense. The actual NAV movement is shown below.

The point of this exercise is to illustrate how the annualised return calculation sweeps the NAV ups and downs under the carpet and focusses only on the initial NAV and final NAV. There are literally millions of smooth curves that I can draw between the end points and what is shown above is just one.
When you buy something from Amazon, you don’t care whether the delivery guy braved the hot sun or floods. All you care about is the condition of the package. You ordered something at a price and you got it in one piece – only the start and end points matter.
When you buy anything that is market-linked, you are not the end-user. You are in charge of the delivery department. You need to deliver your own net worth to where it needs to be. Therefore, the route matters. In other words, the ups and downs matter – not just the end result which is unpredictable. The volatility associated with a return matters.
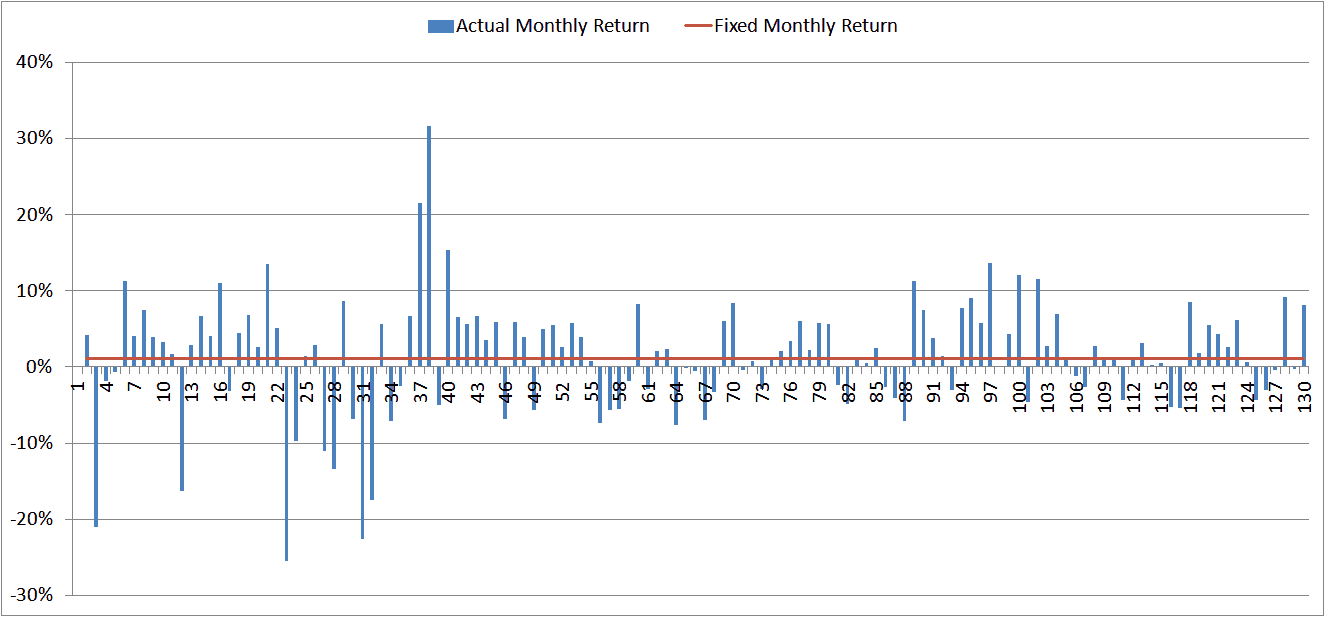
Suppose we assume each month has about 21 business days and computed the “monthly” returns from April 2006 to April 2017, we would get 129 months.
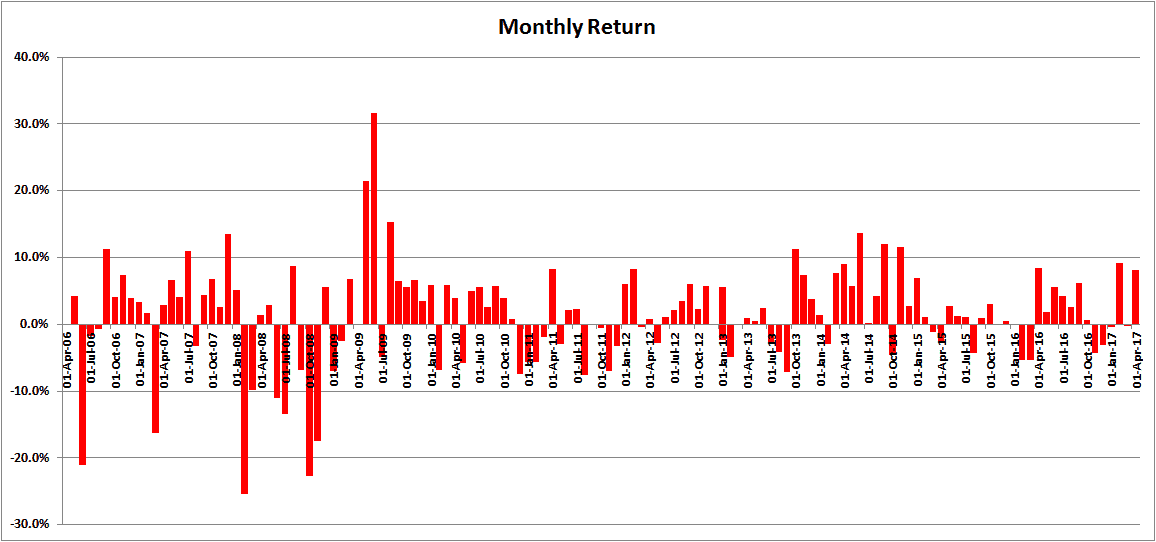
This is an absolute view of the volatility. When we invest in equity, it is better to temper ourselves that -20% monthly returns are more than possible. When such returns occur will decide the wealth we create – early, middle or later in the investment schedule. More on that later.
Problems arise when we start to replace this view with a single number. If we bin the returns into compartments, this is what we get.
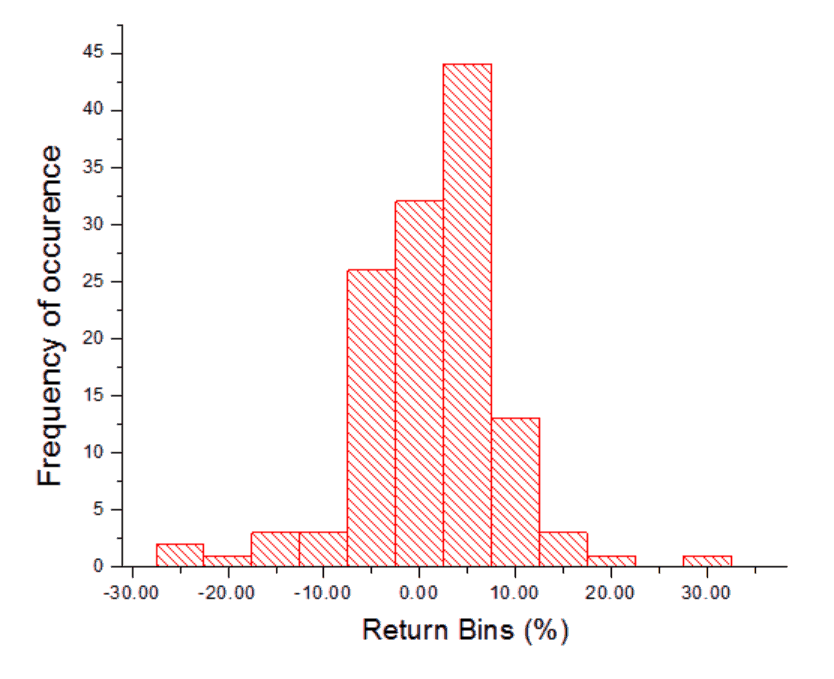
This is anything but a bell curve or a normal distribution. Therefore the idea of an “average” monthly return is not valid. And by extension, the “average” deviation from the “average return”, also known as the standard deviation is also invalid. The standard deviation is the “industry standard” representation of volatility and it is wrong.
IF we assume that NAV grows by the same amount each month, then
final NAV = initial NAV x (1+monthly_return)^129
monthy_return ~ 1.15%
Instead of the standard deviation, a simpler way to depict volatility is to define it as:
No of negative monthly returns/Total monthly returns
For the present case, this is 45/129 ~ 35%.
This gives me an idea of what to expect from this fund (or this category of funds) over the next 10 years: Expect NAV to fall for at least 1/3 rd of the months invested. Now let us try selling mutual funds with statistic!
=-=-=-=-=-=-=
Kolkata DIY Investor Workshop May 28th, 2017
Register for the Kolkata DIY Investor Workshop May 28th, 2017
You Can Be Rich Too With Goal-Based Investing
You can be rich too with goal based investing is my new book with PV Subramanyam. If you have not yet got the book, check out the reviews below and use the links to buy.
Reader Quotes:
Gift it to your Friends and Relatives whom you care more. Already follower of Pattu and Subra’s forum. Ordered 4 more copies to give gift to my friends and eagerly waiting to read
The best book ever on Financial Freedom Planning. Go get it now!
Your first investment should be buying this book
The (nine online) calculators are really awesome and will give you all possible insights
Thank you, readers, for your generous support and patronage.

Amazon Hardcover Rs. 317. 21% OFF
Kindle at Amazon.in (Rs. 307)
Google
Infibeam Now just Rs. 307 24% OFF.
If you use a mobikwik wallet, and purchase via infibeam, you can get up to 100% cashback!!
Bookadda Rs. 344. Flipkart Rs. 359
Amazon.com ($ 3.70 or Rs. 267)
Google Play Store (Rs. 244.30)
- Ask the right questions about money
- get simple solutions
- Define your goals clearly with worksheets
- Calculate the correct asset allocation for each goal.
- Find out how much insurance cover you need, and how much you need to invest with nine online calculator modules
- Learn to choose mutual funds qualitatively and quantitatively.
More information is available here: A Beginner’s Guide To Make Your Money Dreams Come True!
What Readers Say