Last Updated on December 29, 2021 at 6:08 pm
HDFC Bank has been a favourite investment for a lot of investors in the Indian equities – be it Retail Investors, Fund Managers, FIIs, or DIIs. And, with good reason too. HDFC Bank has outperformed almost every bank in India in terms of stock price performance. An analysis.
About the author: Arjun Budhraja is an MBA in finance with fifteen years of experience in the finance sector. He currently is an entrance exam CAT, GMAT, Law, BBA, etc.) coach. His interests include Personal Finance and Equity Markets. The opinions expressed in the article are solely the author’s and do not reflect the opinions of freefincal.
Here’s a chart showing the comparison with a few banks over the last 10 years. HDFC Bank stock price has given an appreciation of more than 550% since 2011 compared to less than 200% for others, with SBI being an absolute laggard. The only bank which can claim to have matched HDFC Bank’s performance is Kotak Mahindra Bank (KMB, not available on this chart).

Through this article let us try to understand why this has happened, and more importantly, whether this outperformance can continue in the future. For this analysis, let us look at some basic parameters of company & stock performance.
🔥Secure your future with our Robo-advisory tool trusted by over 3,500 investors and advisors. From effortless retirement planning to funding your children’s biggest dreams, turn your financial goals into reality. 🔥
Subscribe for money management solutions via email! (Link takes you to our email sign-up form) Join 32,000+ readers in our community.
👉 New Tool Alert! NaviPlan: A Privacy-Focused Multi-asset Tracker and Goal Planner 👈
Firstly, let us take the Compounded Annual Growth Rate (CAGR) of Revenue of various banks for the last 10 completed financial years. Immediately one can see the outperformance of HDFC Bank (and KMB) as compared to other large banks.
Stock | Revenue CAGR (2010-2020) |
| HDFC Bank | 22.37% |
| ICICI Bank | 10.90% |
| Kotak Mahindra Bank | 21.95% |
| Axis Bank | 18.53% |
| SBI | 10.43% |
Another important thing is that while for other banks, the growth rate has fluctuated over the years (sometimes even recording negative growth), the growth of HDFC Bank has been more or less consistent around the 15%-25% range. This is significant because all investors like to have surety, and are ready to pay a premium for this safety net of certainty.
Next, let us look at the CAGR of Net Profit (Profit left after all expenses). Here also we see a similar outperformance by HDFC Bank & Kotak Mahindra Bank. Here too, HDFC Bank’s growth has been largely consistent over the years.
Another important thing to notice here is that the CAGR of net profit is higher than the CAGR of Revenue for HDFC Bank – which means that their operational performance has been getting better over the years.
*Axis Bank is negative due to a large one-time loss in FY 2020 but even without that their growth would not have been close to HDFC Bank
Stock | Net Profit CAGR (2010-2020) |
| HDFC Bank | 24.67% |
| ICICI Bank | 7.43% |
| Kotak Mahindra Bank | 21.72% |
| Axis Bank | -2.86% |
| SBI | 5.35% |
The next metric we look at is the CAGR of the stock price. The movement in stock price is likely to follow the trend of revenue and net profit, and we can see this quite clearly here. You might notice that the stock performance of KMB is better than HDFC Bank despite HDFC Bank being better in Revenue CAGR and Net Profit CAGR.
This can mean one of two things: Either KMB was underpriced in 2010 and through this outperformance it has caught up with the valuation of HDFC Bank, or that KMB is now overpriced as compared to HDFC Bank. In my opinion, it is the latter.
Stock | Stock Price CAGR (2010-2020) |
| HDFC Bank | 22% |
| ICICI Bank | 13% |
| Kotak Mahindra Bank | 25% |
| Axis Bank | 11% |
| SBI | 4% |
Now, let’s take a look at Gross NPA. Gross NPA simply includes all the loans where EMIs were not received for 3 continuous months. Even though this data is a bit old, a similar pattern has continued for both HDFC Bank & Kotak Mahindra Bank while for others numbers have either remained the same or become worse.
This reflects good lending practices at HDFC Bank and KMB. Their internal checks and balances, and set procedures and guidelines protect them from lending money to risky borrowers.
Bank | Gross NPA Total (2014-2018) |
| HDFC Bank | 25313 crore |
| ICICI Bank | 147221 crore |
| Kotak Mahindra Bank | 12540 crore |
| Axis Bank | 68873 crore |
| SBI | 552273 crore |
After Gross NPA, the next numbers have to be Net NPA. Net NPA means Gross NPA minus the amount already set aside as provisions for any future defaults. Here also, HDFC Bank and Kotak Mahindra Bank outperform everyone else.
For both Gross NPA and Net NPA, the performance of HDFC Bank is much more impressive that KMB. This is so because HDFC Bank is much larger in size (more than 3x).
On this metric too, other banks have done either much worse than the period mentioned above or have just about managed to maintain their mediocre performance.
Bank | Net NPA Total (2014-2018) |
| HDFC Bank | 7481 crore |
| ICICI Bank | 75556 crore |
| Kotak Mahindra Bank | 5827 crore |
| Axis Bank | 30082 crore |
| SBI | 283625 crore |
Another important number tracked by investors in the banking sector is the Net Interest Margin (NIM). It refers to the interest rate paid by the bank and the interest rate it collects on loans given.
Here also, HDFC Bank & KMB outperform all other banks with both of them having NIM of above 4% while a lot of other banks are in the range of 2%-3.5% and some are even lower than that.
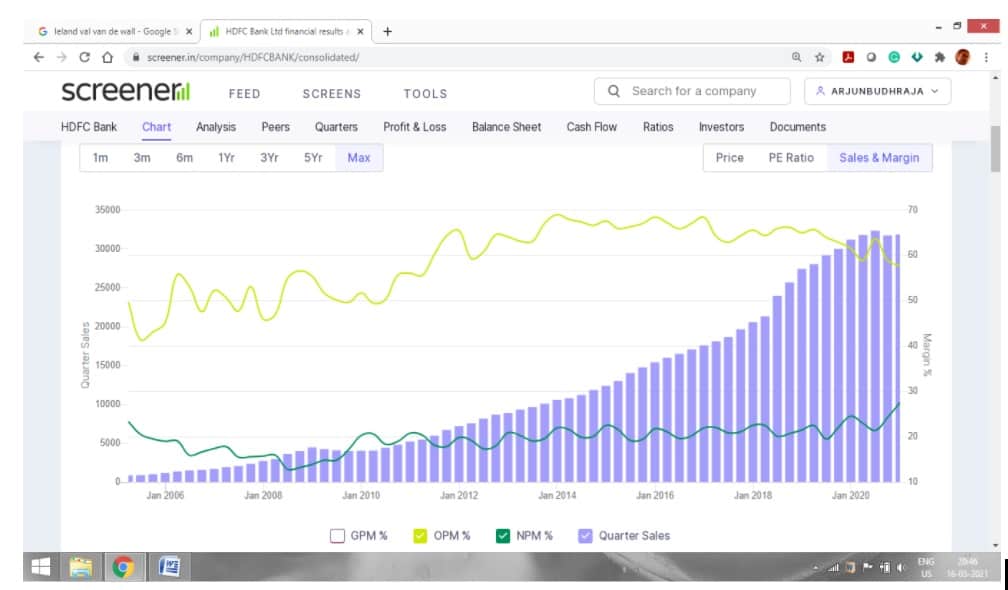
Operating Profit Margin (OPM): Out of all the major banks in India, only HDFC Bank has maintained a positive Operating Profit Margin and a positive Net Profit Margin for every quarter in the last 10 years. That speaks volumes about their operational efficiency.
The credit for this fantastic performance by the bank has been given to the internal policies and processes developed and enforced by the management of HDFC Bank. This in-built intangible strength of the bank should help the bank keep up the outperformance in the future as well.
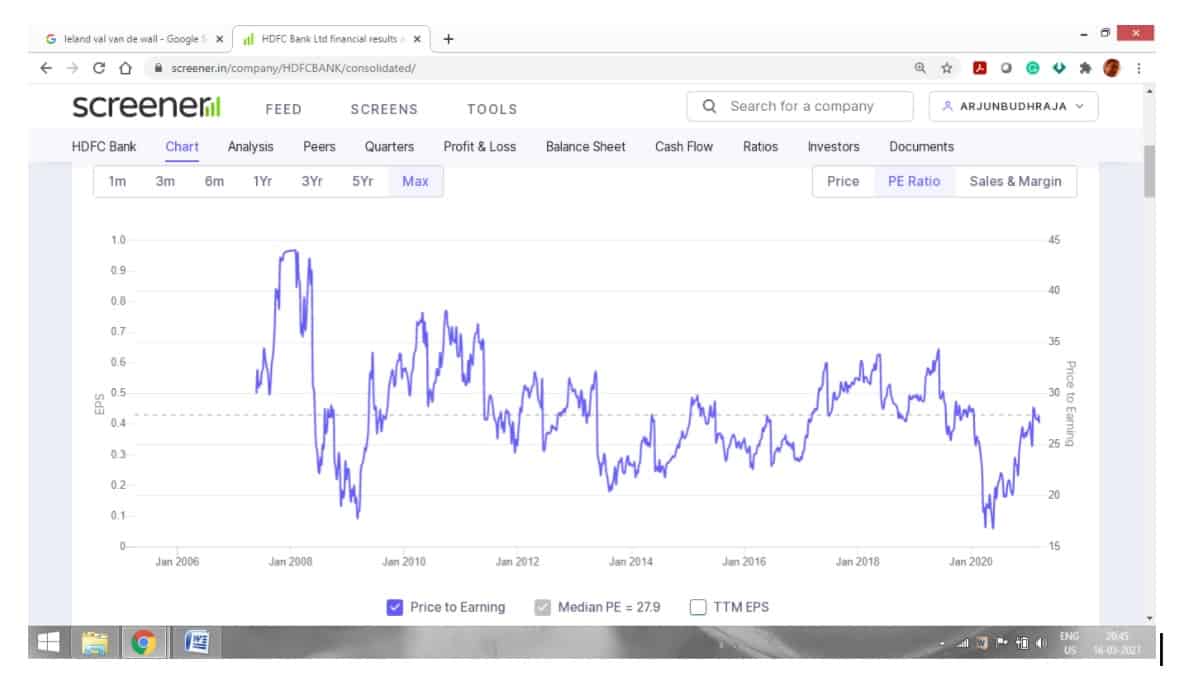
In the below chart, you can see that the current Price-to-Earnings ratio (PE Ratio) of HDFC Bank is near to the median PE ratio over the last 15 years. An interpretation of this is that compared to the last 15 years, the stock is not overpriced. But one has to consider that since HDFC Bank has been performing really well over many years, their PE Ratio has been on the higher side compared to other Indian banks for most of these 15 years.
What does all this mean for the future and what should you do?
For any long term investor with an equity portfolio, around 30% of the total amount should be dedicated to the financial services sector – this is because around 30% of Nifty’s market capitalisation is in the Financial Services sector – and HDFC Bank is one of the prime candidates to be included into your portfolio.
The only bank whose business performance and stock price performance have come close to HDFC Bank is Kotak Mahindra Bank. At least one of these should be part of any well-diversified equity portfolio.