Last Updated on December 29, 2021 at 5:49 pm
In this article, we show how the NAV of an index fund or the price of an ETF is affected by a market crash and discuss a simple, effective way to measure tracking error. That is how well the fund or ETF was able to track the underlying total returns index.
Textbooks define tracking error as the standard deviation of “difference between the returns of an investment and its benchmark”. This is always a positive number and higher the value, more the deviation. What many investors fail to appreciate is, the tracking error depends on the time window chosen. That is tracking error over the last one year is different from that over the last two years.
This definition does not distinguish between underperformance (index fund return less than benchmark return say over a month) and outperformance (index fund return higher than the benchmark). As pointed by Siva from Facebook group, Asan Ideas for Wealth (privately), expenses do not result in tracking error!
That is if you remove say, 1% annual fee from the Nifty TRI data (distributed daily), the return difference bet the bare data and the processed data is 1%, but the tracking error is zero. This is because there is no variation in return between the index data and our imaginary index fund.
🔥Secure your future with our Robo-advisory tool trusted by over 3,500 investors and advisors. From effortless retirement planning to funding your children’s biggest dreams, turn your financial goals into reality. 🔥
Subscribe for money management solutions via email! (Link takes you to our email sign-up form) Join 32,000+ readers in our community.
👉 New Tool Alert! NaviPlan: A Privacy-Focused Multi-asset Tracker and Goal Planner 👈
This is because the tracking error is measured as a standard deviation. If you invest in a fixed deposit, the monthly return is the same each month. So the standard deviation is zero. The reason here is the same if the daily expense ratio is the same and there are no other factors that affect the fund management.
Thus the main reason for tracking error in an index fund is fund in and outflows and the difficulty in trying to copy changes to the index. These, in turn, depend on how easy or difficult it is to buy or sell stocks. Siva also showed that it is possible to construct an index fund NAV that has the same return as that of the index but with significant tracking error. The tracking error is non-intuitive and unsuitable for use by retail investors.
A fund with a low expense ratio can have a high tracking error: This has been established in multiple articles:
- Selecting index funds: Lowest expenses does not mean lowest tracking error!
- ICICI Nifty Next 50 Index Fund vs Reliance ETF Junior BeEs
- ETFs vs Index Funds: Stop assuming lower expenses equals higher returns!
- Which Nifty, Nifty Next 50, Sensex index funds have the lowest tracking error?
- Which Nifty Index Fund has the lowest tracking error?
To make things worse, the return and tracking error of an ETF are measuring using its NAV data, while investors buy and sell at market price. This price movement can deviate significantly from the NAV movement especially during a market crash when there is a sudden drop in demand.
We plot below the rolling monthly return difference between Nifty 50 TRI and Nippon India Nifty Bees price (blue) and NAV (red). The price data is so huge that we had to multiply the NAV data by ten and it is still small! Stay away from ETFs unless you want to trade in real-time!
How a market crash affects index funds
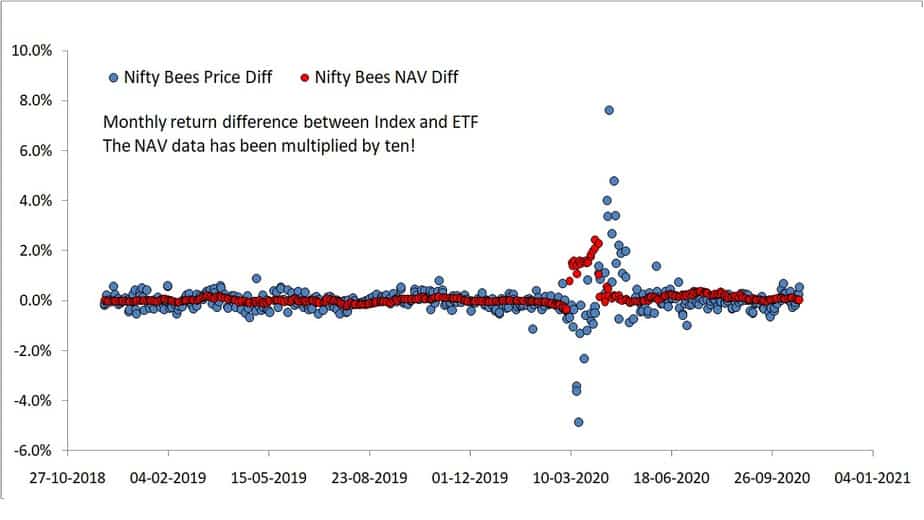
Notice how much the tracking error measured with the NAV data misrepresents reality even far away from the crash! Every return that is mentioned online is based on NAV and not on the price! The huge upward and downward spike correspond to the March 2020 crash.
Ideally Nifty 50 TRI monthly return – Nippon India Nifty Bees ETF NAV monthly return should be positive. That is over a month, the index will always have a higher return primarily because of the expenses associated with the ETF (or any index fund). Out of the 469 monthly return differences studied, the ETF NAV return was higher than that of the index 196 times! This is clear evidence that difficulty in aligning the portfolio with that of the index is the main reason for this return difference – so much that it negates the loss due to expenses!
In our opinion, studying this return difference is a simpler and superior way than computing tracking error as a standard deviation. The ETF price return is expected to oscillate above and below that of the index return due to demand and supply fluctuations. This is welcome as long as the swings are small and bi-directional (both ways).
Let us now consider one of the worst index fund performers: Tata Nifty Index fund. Currently, this has the same expense ratio as that of Nippon Nifty Bees. The negative blue dots represent monthly returns of fund which were higher than the index.
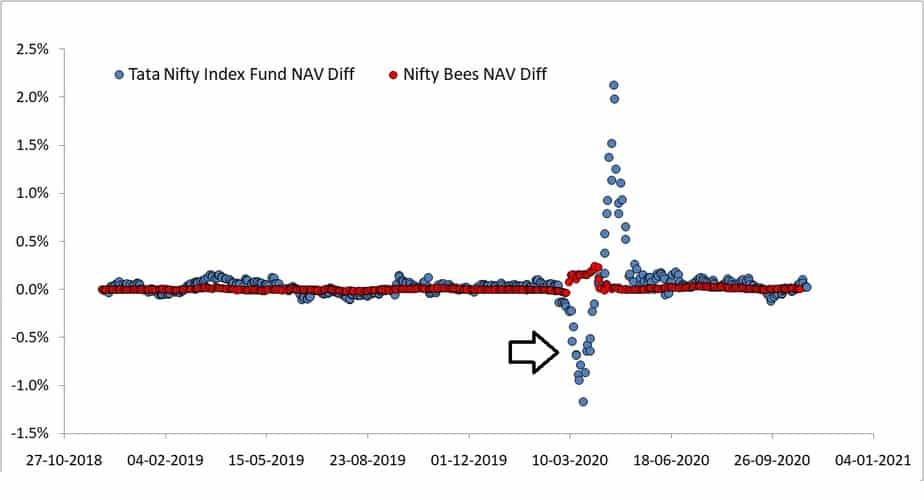
During a market crash, the negative deviation is sharp, but such deviations can occur on any given day. As many as 148 such negative return differences were seen for the Tata fund and 196 for Nifty Bees ETF (with NAV).
A better way to measure tracking error
Instead of reporting a single always positive number as tracking error, we can quantify deviations from the index in the following ways:
- no of times fund return or etf return (with price) was higher than then index for a month. This means the index – fund monthly return difference is negative.
- The gap between the max return difference and min return difference
- These along with few other quantities are tabulated below.
| Quantity | Nippon India Nifty Bees Price | Nippon India Nifty Bees NAV | Tata Index Fund-Nifty Plan(G)-Direct Plan | Franklin India Index Fund-NSE Nifty(G)-Direct Plan |
| No of negative monthly return difference | 244 | 196 | 148 | 87 |
| Total monthly returns | 474 | 469 | 469 | 469 |
| median monthly return difference | -0.01% | 0.00% | 0.03% | 0.05% |
| stdev of monthly return differnces | 0.72% | 0.03% | 0.25% | 0.17% |
| avg monthly return difference | -0.13% | 0.00% | -0.02% | 0.10% |
| max monthly return difference | 7.63% | 0.24% | 2.13% | 1.22% |
| min monthly return difference | -4.86% | -0.04% | -1.17% | -0.66% |
If someone were to study the ETF NAV alone, they would be impressed with the gap between the max and min monthly return differences: 0.24% – (-0.04%) = 0.28%. Only if they bother to look at this difference based on the price they would appreciate it is as high as 12.49%.
Compared to this, the Franklin fund has fared reasonably well with a spread of 1.89% and only 87/469 instances of fund outperformance (negative return difference). These quantities are intuitive and easier to understand than the tracking error. As one can see from the above table, the median and average of the return differences are quite different. This makes the standard deviation (conventional tracking error) an incorrect measure unrepresentative of the actual spread.
A monthly tracking error data sheet with this data will soon be made available. The top 2-3 funds in this list are not names you would see commonly in DIY forums 🙂