In this article, we look at how 200 indices representing the stock market, bond market and other asset classes performed in 2021. This is measured with 361 days absolute return from 1st Jan 2021 to 28th Dec 2021.
Note: The following information should not be used for making investment decisions. Past performance is not an indicator of future performance. We urge readers to appreciate the difference between looking at data as an analyst or curious observer and looking at data as an investor. In this article, we don the cap of a curious observer.
2021 was the year of the IPO, particularly those belonging to the small and mid cap universe. The S&P BSE SME IPO index measures the performance of the small and medium enterprises (SME) after they list. The index grew an astonishing 959% in 2021!
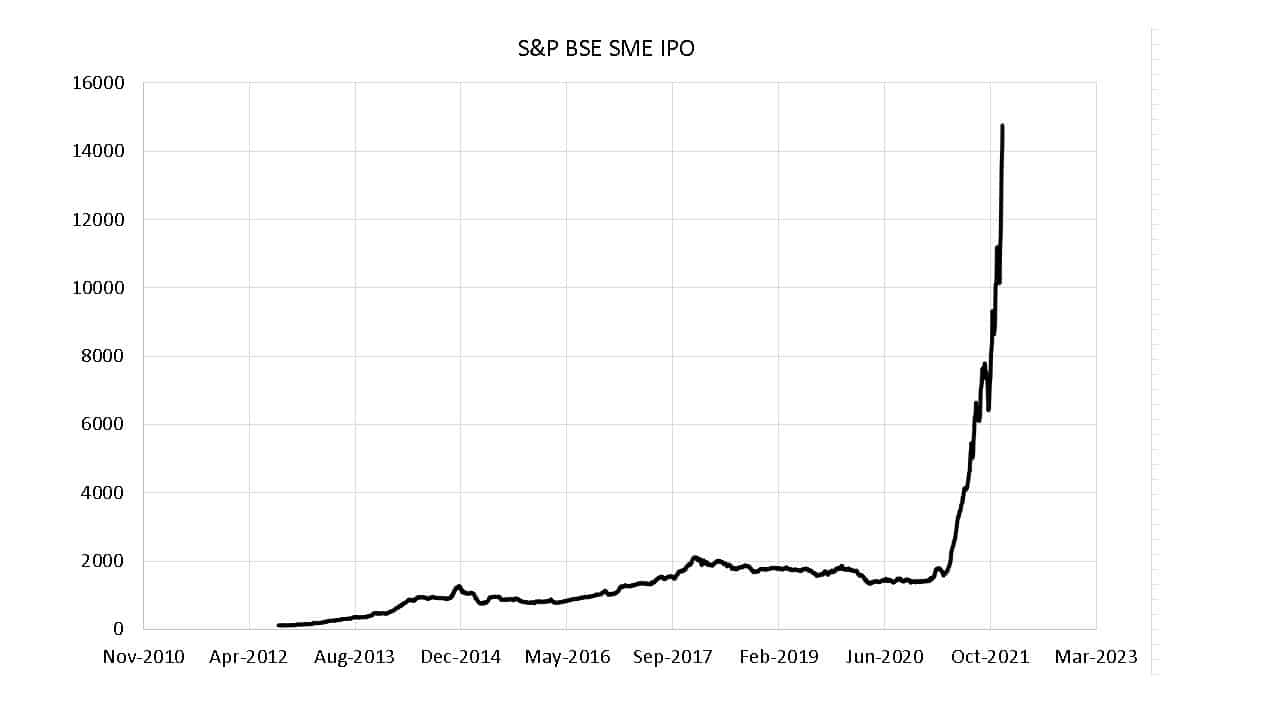
The BSE IPO index returned “only” 54% in contrast!
Here are some well-known movers:
🔥Secure your future with our Robo-advisory tool trusted by over 3,500 investors and advisors. From effortless retirement planning to funding your children’s biggest dreams, turn your financial goals into reality. 🔥
Subscribe for money management solutions via email! (Link takes you to our email sign-up form) Join 32,000+ readers in our community.
👉 New Tool Alert! NaviPlan: A Privacy-Focused Multi-asset Tracker and Goal Planner 👈
- Nifty Smallcap 250 – TRI 58.3%
- Nifty 200 Momentum 30 TRI 52.8%
- Brent Crude 52.2%
- Nifty Midcap 150 – TRI 44.6%
- NIFTY 50 Equal Weight Index – TRI 33%
- NIFTY 100 Equal Weight Index – TRI 31.9%
- NIFTY 500 – TRI 29.8%
- NIFTY NEXT 50 – TRI 29.1%
- Nasdaq-100 28.5%
- S&P 500 27.6%
- NIFTY 100 – TRI 25.2%
- NIFTY 50 – TRI 24.4%
- Nifty 100 Quality 30 Index – TRI 20.2%
- CRISIL Hybrid 35+65 – Aggressive Index 19%
- Crisil 1 Yr T-Bill Index 3.4
- Nifty 10 yr Benchmark G-Sec Index 1.2%
- Gold-London AM (INR) -1.7%
When equal-weight indices outshine their capitalization-weighted counterparts it is a sign that actively managed mutual funds have done better. See: How did equity mutual funds perform in 2021?
If something can be inferred from this it is this: We had no idea the markets would crash in 2020 and we had no idea they would recover as they did in 2020 and continue moving up in 2021. The worst mistake one can do is wait on the sidelines for the right time to invest.
We urge readers to invest systematically in 2022 and learn to manage risk in a goal-based manner systematically. Here is a resource to get started: Basics of portfolio construction: A guide for beginners.
Here is the full list of 199 indices.
| Index | 2021 Returns |
| S&P BSE SME IPO – TRI | 959.3 |
| NIFTY SME EMERGE Index – TRI | 120.6 |
| NIFTY DIVIDEND | 87.4 |
| S&P BSE Power Index – TRI | 74.3 |
| NIFTY METAL – TRI | 73.7 |
| S&P BSE METAL Index – TRI | 72.7 |
| S&P BSE Utilities – TRI | 71.7 |
| Nifty Alpha 50 – TRI | 70.2 |
| MerVal | 65.1 |
| S&P BSE Industrials – TRI | 64.7 |
| Nifty Tata Group 25% Cap – TRI | 62.9 |
| S&P BSE Basic Material – TRI | 61.7 |
| S&P BSE Small-Cap – TRI | 59.6 |
| NIFTY IT – TRI | 59.6 |
| Nifty Smallcap 250 – TRI | 58.3 |
| S&P BSE SmallCap Select Index | 56.7 |
| S&P BSE Information Technology – TRI | 55.6 |
| Nifty Smallcap 100 – TRI | 55.4 |
| Nifty Aditya Birla Group – TRI | 54.4 |
| S&P BSE 250 Small Cap – TRI | 54.2 |
| NIFTY500 Value 50 – TRI | 54.1 |
| S&P BSE IPO Index – TRI | 54.1 |
| S&P BSE Realty Index – TRI | 53.7 |
| S&P BSE IT | 53.3 |
| NIFTY REALTY – TRI | 53.2 |
| Nifty 200 Momentum 30 TRI | 52.8 |
| Brent Crude | 52.2 |
| S&P BSE Capital Goods – TRI | 52.2 |
| NIFTY COMMODITIES – TRI | 49.2 |
| S&P BSE TECk Index – TRI | 48.9 |
| Nifty MidSmallcap 400 Index – TRI | 48.6 |
| S&P BSE MidSmallCap – TRI | 48.6 |
| S&P BSE 400 MidSmallCap Index – TRI | 47.8 |
| Nifty Smallcap 50 – TRI | 47.5 |
| S&P BSE Enhanced Value Index | 47.3 |
| S&P BSE PSU – TRI | 46.2 |
| Nifty 50 TR 2x Leverage | 46.2 |
| Nifty Mahindra Group – TRI | 46.0 |
| Nifty Tata Group – TRI | 45.2 |
| S&P BSE 150 MidCap – TRI | 45.0 |
| NIFTY CPSE Index – TRI | 44.9 |
| Nifty Midcap 150 – TRI | 44.6 |
| S&P BSE Consumer Durables – TRI | 44.5 |
| S&P BSE India Infrastructure Index | 44.1 |
| Nifty Midcap 100 – TRI | 44.1 |
| S&P BSE 150 MidCap | 43.9 |
| NIFTY PSE – TRI | 43.5 |
| NIFTY MAHINDRA | 42.8 |
| Nifty 50 PR 2x Leverage | 42.8 |
| Nifty Midcap 50 – TRI | 40.8 |
| Nasdaq Computer | 40.7 |
| NIFTY PSU BANK – TRI | 40.1 |
| Nasdaq Bank | 39.9 |
| ATX | 39.3 |
| NIFTY ENERGY – TRI | 38.9 |
| S&P BSE Telecom – TRI | 38.5 |
| Nifty Midcap Liquid 15 – TRI | 38.0 |
| Nifty 500 Shariah – TRI | 37.5 |
| S&P BSE Mid-Cap – TRI | 37.2 |
| NIFTY INFRA – TRI | 36.6 |
| LIX 15 MIDCAP | 36.4 |
| Nifty 50 Value 20 Index – TRI | 35.2 |
| NIFTY MEDIA – TRI | 35.0 |
| Nifty LargeMidcap 250 Index – TRI | 34.7 |
| S&P BSE 500 Shariah – TRI | 34.2 |
| NIFTY MEDIA | 33.9 |
| Nifty High Beta 50 – TRI | 33.9 |
| NIFTY 50 Equal Weight Index – TRI | 33.0 |
| S&P CPSE | 32.6 |
| S&P BSE Bharat 22 Index | 32.5 |
| HIGH BETA | 32.5 |
| NIFTY DIV OPPS 50 – TRI | 32.4 |
| S&P BSE 250 LargeMidCap 65:35 Index – TRI | 32.2 |
| NIFTY 100 Equal Weight Index – TRI | 31.9 |
| S&P BSE OIL & GAS Index – TRI | 31.6 |
| S&P BSE GREENEX – TRI | 31.1 |
| Dow Jones Trasportation Averag | 31.0 |
| S&P BSE AllCap – TRI | 31.0 |
| S&P BSE 250 LargeMidCap 65:35 | 30.8 |
| NIFTY 50 Shariah – TRI | 30.3 |
| Nifty 100 ESG Index – TRI | 30.1 |
| Nifty 100 Liquid 15 – TRI | 30.1 |
| NIFTY100 Enhanced ESG – TRI | 30.0 |
| S&P BSE 500 – TRI | 29.9 |
| NIFTY 500 – TRI | 29.8 |
| S&P BSE Sensex Next 50 – TRI | 29.4 |
| NIFTY NEXT 50 – TRI | 29.1 |
| NIFTY100 LIQ 15 | 28.7 |
| CAC 40 | 28.6 |
| S&P 100 | 28.6 |
| Nasdaq-100 | 28.5 |
| S&P BSE 250 LargeMidCap Index – TRI | 28.4 |
| NIFTY Alpha Low-Volatility 30 – TRI | 28.2 |
| S&P BSE Consumer Discretionary Goods & Services – TRI | 28.2 |
| S&P BSE MidCap Select Index | 28.1 |
| S&P BSE Energy – TRI | 27.7 |
| S&P BSE 200 – TRI | 27.6 |
| S&P 500 | 27.6 |
| NIFTY 200 – TRI | 27.4 |
| S&P BSE LargeMidCap – TRI | 26.9 |
| S&P BSE 100 ESG Index | 26.7 |
| S&P BSE 200 | 26.1 |
| S&P SmallCap | 25.8 |
| S&P BSE CARBONEX – TRI | 25.4 |
| S&P BSE 100 – TRI | 25.3 |
| S&P BSE Large Cap – TRI | 25.3 |
| NIFTY 100 – TRI | 25.2 |
| Nifty Shariah 25 – TRI | 24.9 |
| S&P BSE Sensex 50 – TRI | 24.5 |
| NIFTY SERV SECTOR – TRI | 24.4 |
| NIFTY 50 – TRI | 24.4 |
| NIFTY Alpha Quality Low-Volatility 30 – TRI | 24.1 |
| Nifty 200 Quality 30 Index – TRI | 24.1 |
| NIFTY Alpha Quality Value Low-Volatility 30 – TRI | 23.8 |
| Nifty 50 Futures TR Index | 23.3 |
| S&P BSE DOLLEX 200 | 23.3 |
| Nasdaq | 23.1 |
| S&P 400 | 22.8 |
| SHARIAH25 | 22.8 |
| S&P BSE India Manufacturing Index | 22.5 |
| Taiwan Capitalization Weighted Stock Index | 22.5 |
| NIFTY 100 Low Volatility 30 Index – TRI | 22.3 |
| Nifty Low Volatility 50 – TRI | 22.3 |
| NIFTY ALPHA QTY Low-VOLAT.30 | 22.3 |
| NIFTY MNC – TRI | 22.2 |
| S&P BSE SENSEX – TRI | 22.2 |
| S&P BSE DOLLEX 100 | 21.0 |
| IPC | 20.9 |
| Dow Jones Composite Index | 20.8 |
| Nasdaq Transportation | 20.7 |
| Swiss Market | 20.2 |
| LOW VOLATILITY | 20.2 |
| Nifty 100 Quality 30 Index – TRI | 20.2 |
| CRISIL Hybrid 35+65 – Aggressive Index | 19.0 |
| NIFTY DEFTY | 18.7 |
| NIFTY QUALITY LOW-VOLATILTY 30 | 18.7 |
| Dow Jones | 18.6 |
| NIFTY CONSUMPTION – TRI | 18.5 |
| BEL-20 | 18.3 |
| S&P BSE DOLLEX 30 | 18.3 |
| NYSE | 18.0 |
| S&P BSE AUTO Index – TRI | 17.7 |
| NIFTY AUTO – TRI | 17.6 |
| S&P BSE Health Care – TRI | 17.0 |
| S&P BSE Quality Index | 16.1 |
| RTS Index | 15.5 |
| DAX | 15.4 |
| FTSE 100 | 14.1 |
| Nifty Financial Services – TRI | 13.7 |
| S&P BSE Finance – TRI | 13.6 |
| CRISIL Short Term Debt Hybrid 60+40 Fund Index | 13.4 |
| Nasdaq Insurance | 13.4 |
| NIFTY BANK – TRI | 13.1 |
| Nasdaq Other Finance | 12.5 |
| S&P BSE BANKEX – TRI | 12.2 |
| Dow Jones Utility Average | 11.1 |
| NIFTY FMCG – TRI | 10.4 |
| Jakarta Composite | 10.0 |
| CRISIL Short Term Debt Hybrid 75+25 Fund Index | 10.0 |
| Nasdaq Industrial | 9.8 |
| S&P BSE Fast Moving Consumer Goods – TRI | 9.7 |
| Straits Times | 9.2 |
| Nifty Growth Sectors 15 – TRI | 8.5 |
| S&P BSE FMCG | 7.4 |
| NIFTY PHARMA – TRI | 7.1 |
| NI15 | 7.0 |
| NIFTY GROWTH SECTOR 15 | 7.0 |
| CRISIL Hybrid 85+15 – Conservative Index | 6.9 |
| Madrid General | 5.9 |
| Nasdaq Telecommunications | 5.3 |
| Nikkei 225 | 4.5 |
| Seoul Composite | 4.4 |
| Crisil Short Term Bond Fund Index | 4.3 |
| Nifty Private Bank – TRI | 4.2 |
| Shanghai Composite | 4.1 |
| Nifty 50 Arbitrage Index | 4.1 |
| Crisil Liquid Fund Index | 3.6 |
| RBI Reference Rate | 3.5 |
| USD INR | 3.5 |
| Crisil 1 Yr T-Bill Index | 3.4 |
| Crisil 91 Day T-Bill Index | 3.4 |
| Crisil Composite Bond Fund Index | 3.4 |
| I-BEX (I-Sec Sovereign Bond Index) | 3.3 |
| Nifty 1D Rate Index | 3.3 |
| Nifty 8-13 yr G-Sec index | 1.9 |
| Crisil 10 Yr Gilt Index | 1.2 |
| Nifty 10 yr Benchmark G-Sec Index | 1.2 |
| Nasdaq Biotechnology | 0.0 |
| Gold-London AM (INR) | -1.7 |
| MCX GOLD SPOT | -3.9 |
| Gold-International | -4.4 |
| Gold-London AM | -5.0 |
| KLSE Composite | -5.7 |
| Bovespa | -11.5 |
| Hang Seng | -14.7 |
| INDIA VIX | -15.8 |
| Nifty 50 PR 1x Inverse | -18.0 |
| Nifty 50 TR 1x Inverse | -18.9 |
| S&P BSE Private Banks Index | -23.1 |