Last Updated on July 23, 2022 at 6:11 pm
In this article, we discuss the results of a tactical entry and exit strategy from gilt mutual funds and find out if it is more rewarding.
Readers unfamiliar with gilt funds may consult our previous work: (1) FAQ on gilt mutual funds: essentials investors should know. (2) Gilt mutual funds will not protect your money! Recognize risks before investing! (3) Can we buy gilt mutual funds now? They have given more than 10% returns in the last year! (4) Can we invest via SIP in gilt mutual funds for the long term?
Note: It must be kept in mind that long-term SIPs in gilt funds (see article 4 above) have been quite productive in the past and should at the very least provide an FD-like return before tax (better than FD after tax for those in 20% and above slabs).
Therefore a simple systematic rebalancing with equity is all that is necessary for most retail investors. The following methodology and results are only for those seeking better profit from gilt mutual funds.
🔥Secure your future with our Robo-advisory tool trusted by over 3,500 investors and advisors. From effortless retirement planning to funding your children’s biggest dreams, turn your financial goals into reality. 🔥
Subscribe for money management solutions via email! (Link takes you to our email sign-up form) Join 32,000+ readers in our community.
👉 New Tool Alert! NaviPlan: A Privacy-Focused Multi-asset Tracker and Goal Planner 👈
Warning and disclaimer: Please recognise results shown in backtests do not factor in future market movements especially sharp price fluctuations and sequence of returns, human emotions, taxation and exit loads. All these would impact the outcome of market timing.
No single strategy would work for all markets and at all times. After extensive backtesting, we have arrived at this strategy as a reasonable choice at the time of original publication. There is no guarantee that it would work in future. Future backtesting may reveal flaws in this strategy or reveal new or modified strategies.
Anyone who uses this tool does so at their own risk. Freefincal or this author/editor is not responsible or liable for any gains or losses that may result from the use of this strategy or the associated tool.
Backtest results for other asset classes: (1) Is this a good time to buy gold? A tactical buying strategy for gold (2) This “buy high, sell low” market timing strategy surprisingly works! (3) Do not use SIPs for Small Cap Mutual Funds: Try this instead!
A tool based on the above strategy is now available: A tool for tactical buying and selling using moving averages.
The timing strategy for gilt mutual funds: We had earlier pointed out that the NAV of a gilt fund cannot be used for tactical play. So we shall use the 10-year gilt yield.
Since yield and price are inversely proportional to each other, we work with the inverse of the 10Y bond yield. This would serve as a bond PE ratio. Recall that the inverse of the Nifty PE is known as the earnings yield. See: Has the market recovered already? Did it even crash?
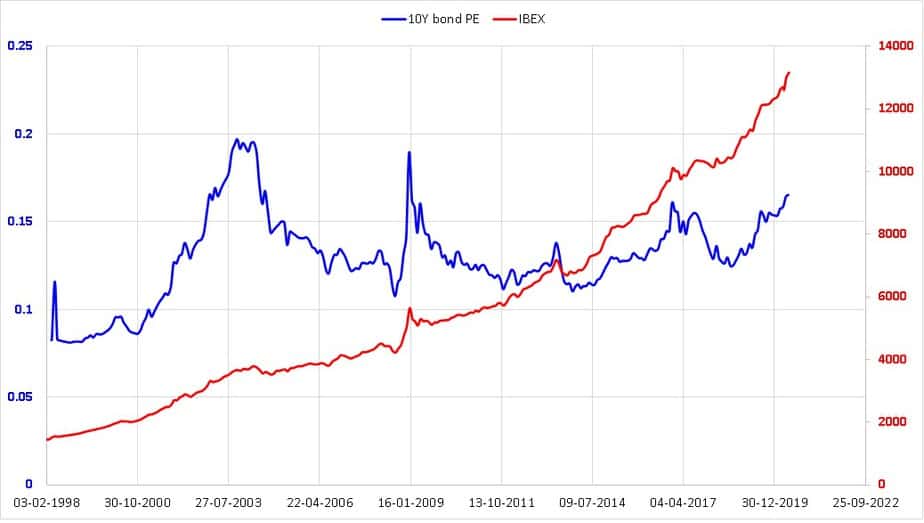
Notice that the 10Y bond PE is significantly more sensitive than the IBEX price. So we shall use this for our gilt timing backseat. We consider two models.
Model 1: Buy gilt funds when bond PE is greater than both the six-month moving average (6MMA) and the 12-month moving average (12MMA). Sell gilt funds when bond PE is less than both MMAs.
Model 2: Buy gilt funds when bond PE is greater than 6MMA. Sell gilt funds when bond PE is less than 6MMA.
This is a screenshot from the double moving average tool with “buy” (=1) and “sell” (=0) indicators (dotted line).
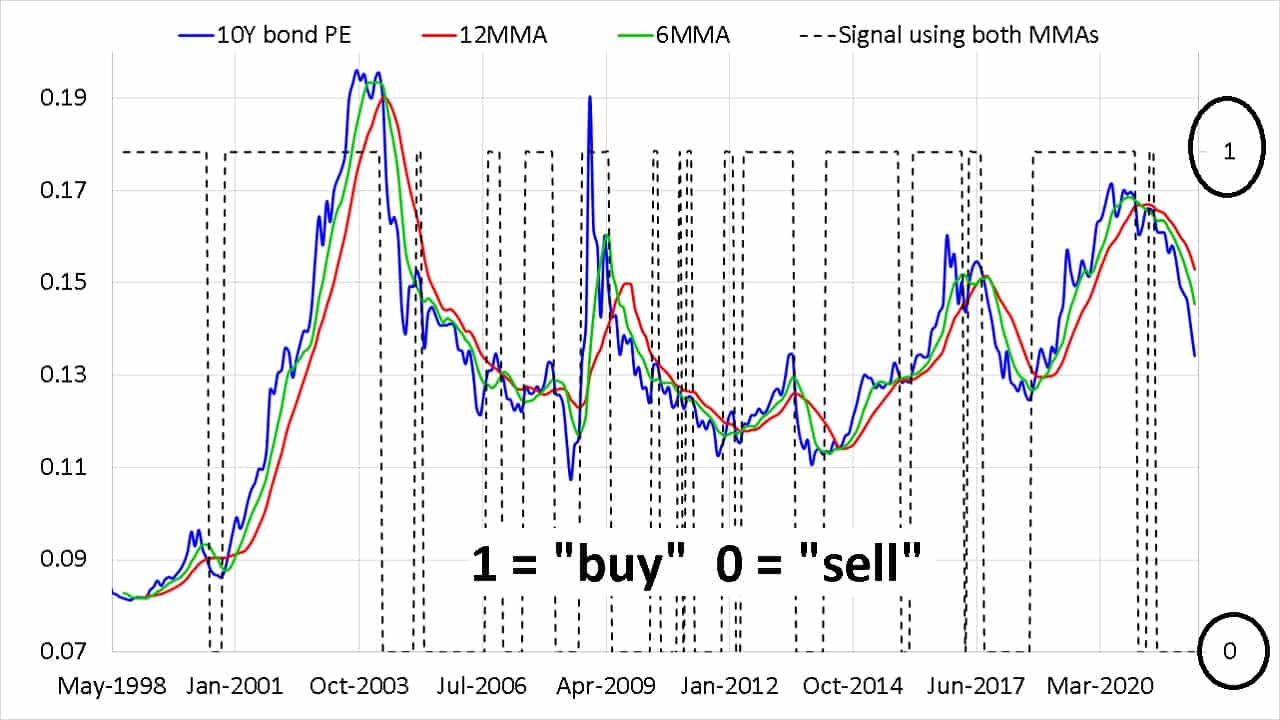
We shall use I-BEX gilt index and the 10-year gilt yield for this study and consider 5-year, 10-year and 15-year durations between May 1998 and May 2022. Please note that results may vary if the test is done with an alternative index or yield.
Systematic approach: Buy a gilt fund each month via SIP.
Tactical approach: Buy/sell a gilt fund using method 1 or method 2. If the model does not indicate “buy” existing investments and future investments will be held as “cash” with a 6% return (before tax).
Method 1: using two moving averages
Five years
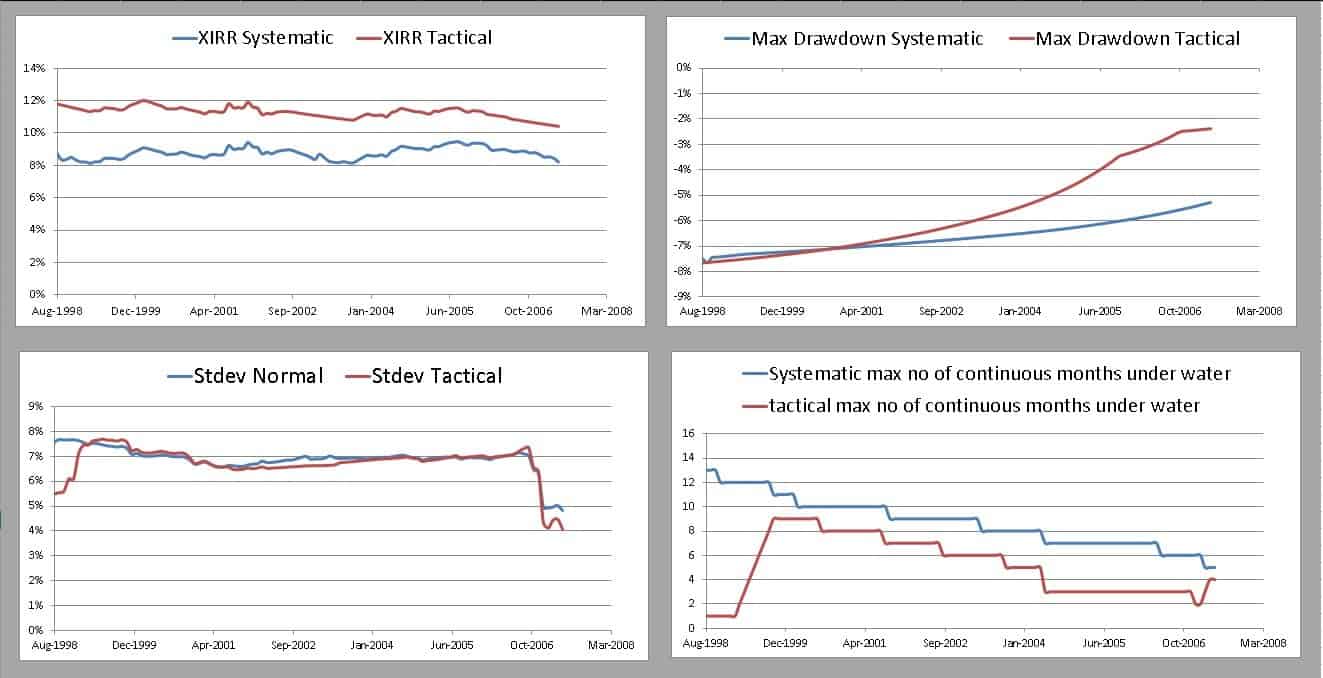
The backtest result for 5 years is shown below. Top left panel: the XIRR for each of the 231 5-year backrests are shown. Not too bad an outcome for the tactical approach. The no of times gilt funds were bought or sold on average (= buy/sell average) is three which is quite reasonable over a five year period.
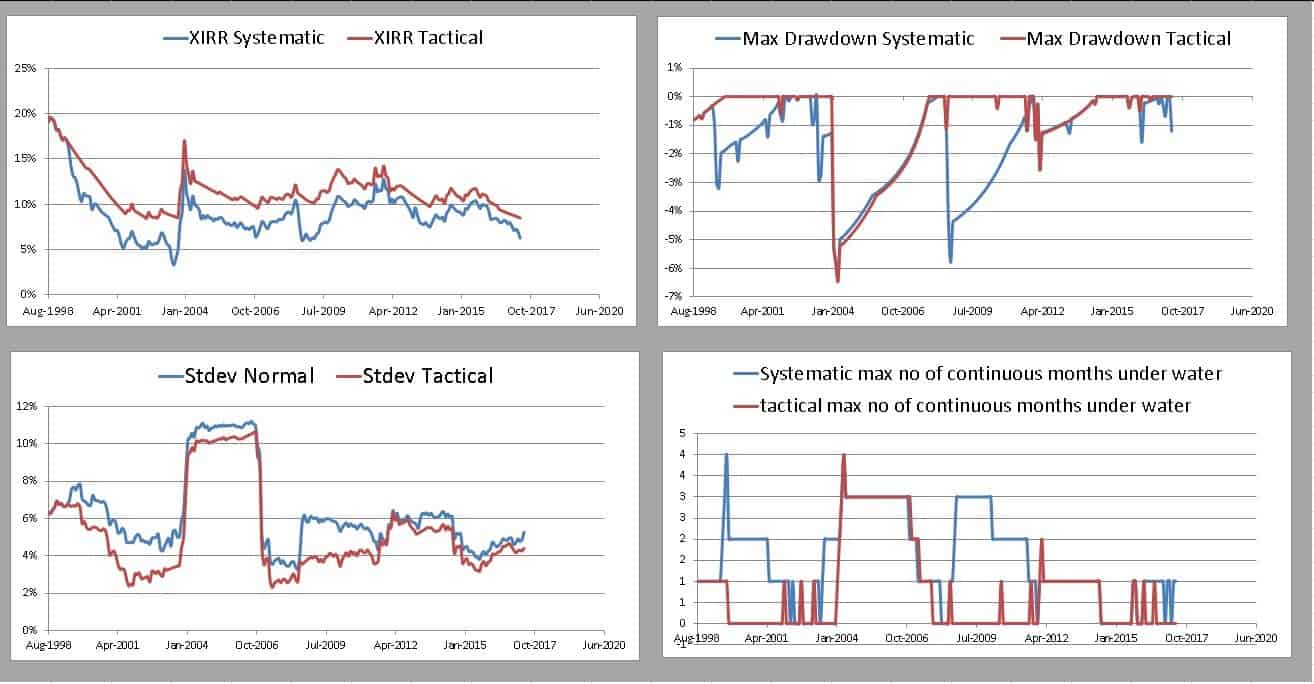
Top right panel: The maximum drawdown (max fall from peak) of the portfolio is shown (less negative the better). For some runs, the tactical approach has a lesser drawdown.
Bottom left panel: The standard deviation or volatility (lower the better). The tactical approach has a bit lower volatility.
Bottom right panel: the max no of months the portfolio was below its peak or underwater (lower the better). The tactical approach does marginally better sometimes.
Ten years: 171 trials were considered. Again the tactical strategy has done fairly well. The buy/sell average is 8.
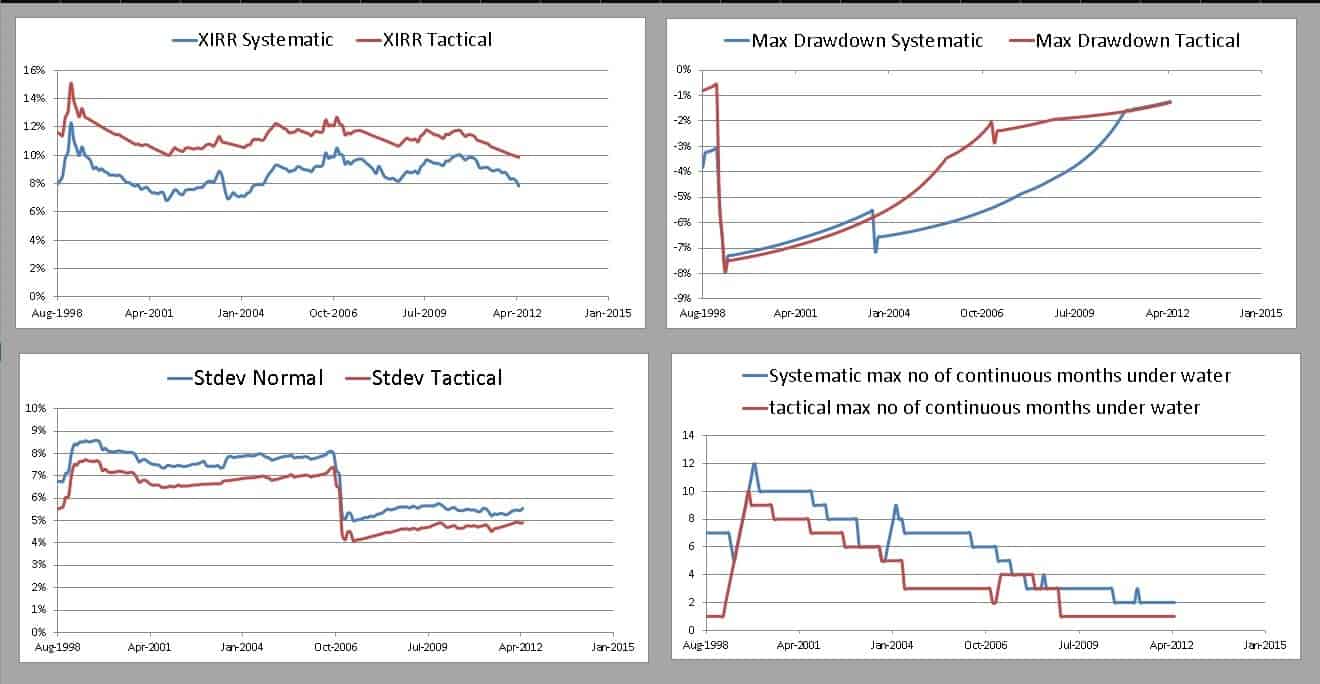
15 years:
Method 2: using 6mma
5 years: Buy/sell average =4
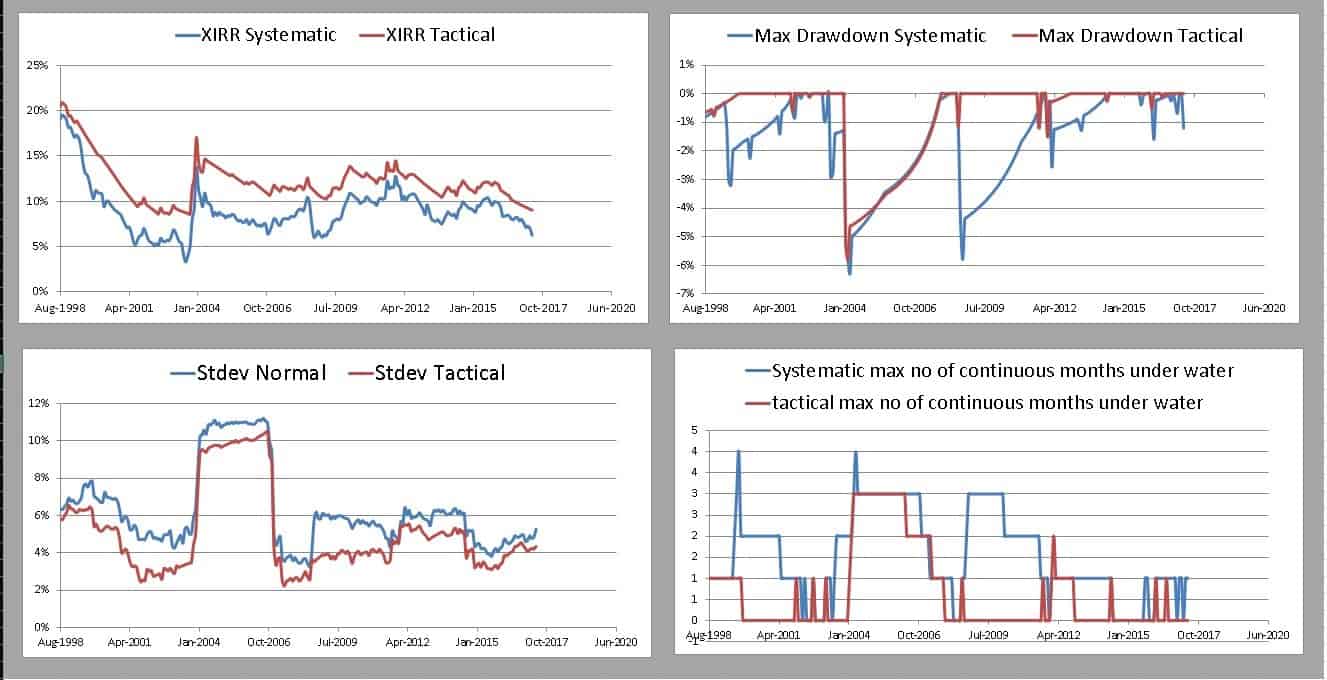
10 years: Buy/sell average =10
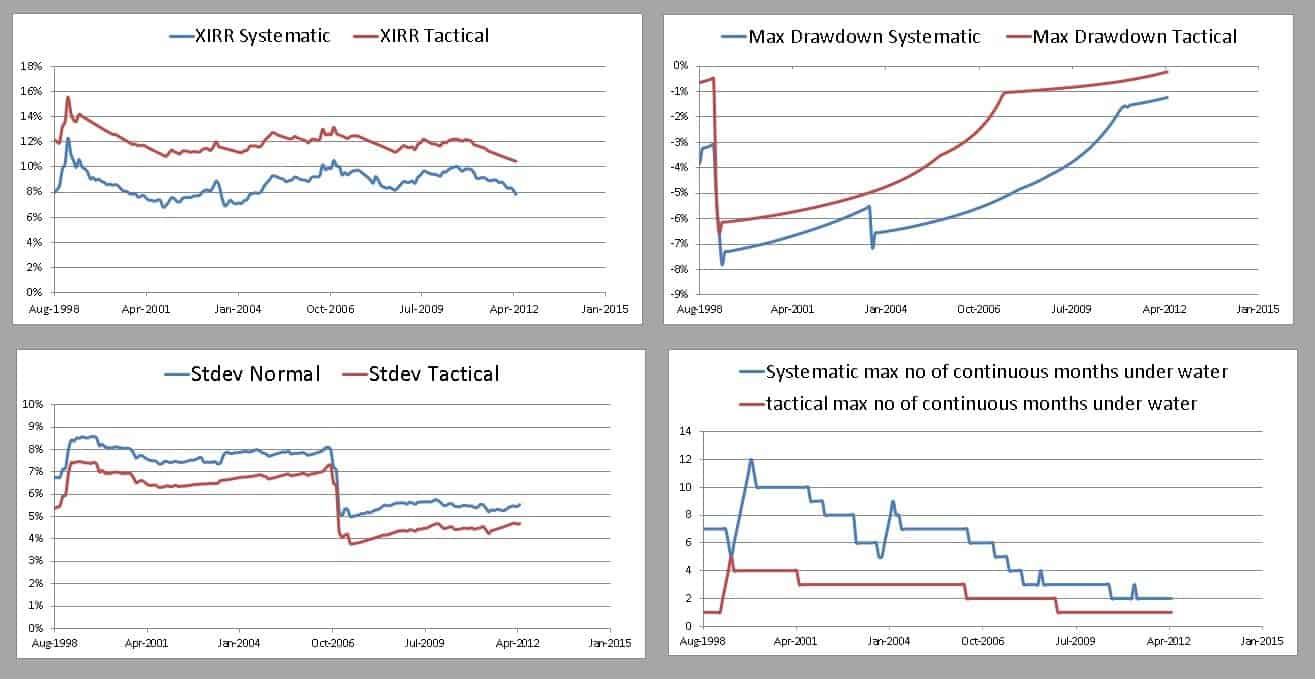
15years: Buy/sell average =15
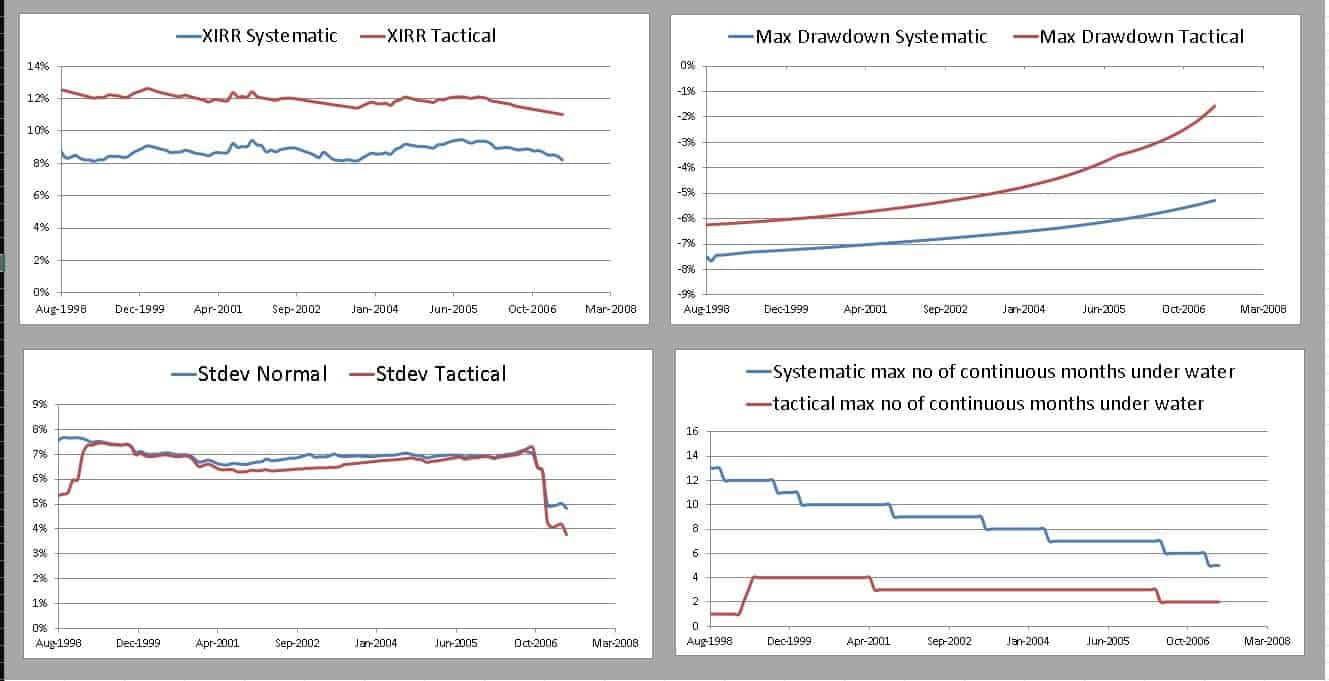
The 6MMA method is a bit more rewarding than the double MMA method. However, the number of buy/sell transactions is higher. Thus tax and exit load would reduce the final reward.
We would caution readers not to get carried away by these results and keep in mind the “no single strategy would work for all markets and at all times” warning mentioned above. A backtest that works 9 times out of 10 would be declared a “successful strategy” by an analyst. However, an investor must be aware that the lone bad result or even worse could their outcome once they start investing. This is also known as the sequence of returns risk.