Last Updated on September 20, 2025 at 5:25 pm
We analyse the performance of multi-asset mutual funds in this article. This category is only four years old introduced by SEBI in 2018 with the re-categorization of mutual funds. Therefore we shall only look at the last 1,2,3, and 4-year trailing returns of multi-asset funds.
According to SEBI, a multi-asset fund invests in at least three asset classes with a minimum allocation of at least 10% in each asset class. Typically these assets are equity, bonds and gold, although silver should also be acceptable. Foreign equity is not considered a separate asset class but can be part of the equity component.
According to AMFI, “A multi-asset fund offers exposure to a broad number of asset classes, often offering a level of diversification typically associated with institutional investing. Multi-asset funds may invest in traditional equity and fixed-income strategies, index-tracking funds, financial derivatives, and commodities like gold.”
The problem with analysing these funds lies in deciding a suitable benchmark. Each fund in this category is benchmarked to custom indices. For example:
🔥Secure your future with our Robo-advisory tool trusted by over 3,500 investors and advisors. From effortless retirement planning to funding your children’s biggest dreams, turn your financial goals into reality. 🔥
Subscribe for money management solutions via email! (Link takes you to our email sign-up form) Join 32,000+ readers in our community.
👉 New Tool Alert! NaviPlan: A Privacy-Focused Multi-asset Tracker and Goal Planner 👈
- Axis Triple Advantage Fund: 65% of Nifty 50 TRI + 20% of NIFTY Composite Debt Index + 15% of INR Price of Gold
- SBI Multi-Asset Fund: 45% CRISIL 10 Year Gilt Index + 40% Nifty 50 + 15% Price of Gold
- ICICI Multi-Asset Fund: Nifty 200 (65%) + Nifty Composite Debt Index (25%) + LBMA (Gold)AM Fixing Prices (10%)
- HDFC Multi-asset Fund: 90% NIFTY 50 Hybrid Composite Debt 65:35 Index + 10% Domestic Price of Gold
- Motilal Oswal Multi-asset Fund:30% Nifty 50 TRI + 50 % Crisil Short Term Gilt Index + 10% Domestic Price of Gold + 10% S&P 500 Index (TRI)
Some benchmarks are “equity-oriented” (in terms of taxation), and some are not. Therfore there is a wide range of investment strategies in this category and binning them together is arguably incorrect.
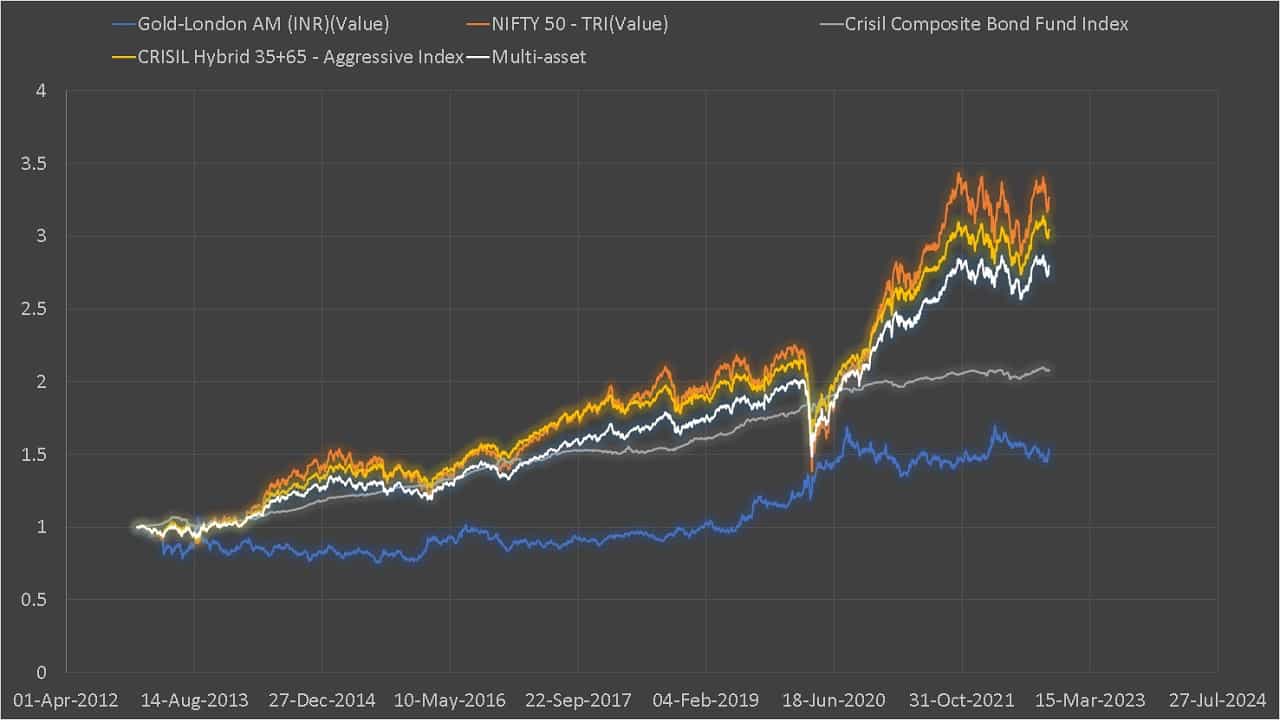
At least to appreciate where each fund stands, we have put together the following benchmark: 65% of Nifty TRI + 20% of CRISIL Composite Bond Fund Index and 15% of Gold INR. We will refer to this as the Multi-asset index. Of course, the choice of weights is arbitrary.
The CRISIL Composite Bond Fund Index has the following indices(!):
- CRISIL Composite Gilt Index 45.00%
- CRISIL AAA Long Term Bond Index 17.00%
- CRISIL AAA Medium Term Bond Index 11.00%
- CRISIL AAA Short Term Bond Index 20.00%
- CRISIL AA and AA+ Long Term Bond Index 2.00%
- CRISIL AA and AA+ Medium Term Bond Index 2.00%
- CRISIL AA and AA+ Short Term Bond Index 3.00%
The evolution of the multi-asset index, with the constituent indices and the CRISIL Aggressive Hybrid index, is shown below. The data is from the 1st of 2013 (inception of direct plans). The multi-asset index is constructed with a simplistic daily rebalancing. A more detailed analysis will be presented later.
The trailing returns are tabulated below. The multi-asset index returns are marked in blue. Nifty 50 TRI returns in red, and funds with a return higher than the multi-asset index are in green.
Note: Kindly do not make any investment decisions based on these numbers. We need more time to analyse these funds.
| Fund/Index | 1 Year | 2 Years |
| Quant Multi Asset Fund(G)-Direct Plan | 9.7679 | 36.1358 |
| ICICI Pru Multi-Asset Fund(G)-Direct Plan | 7.1559 | 33.9666 |
| Tata Multi Asset Opp Fund(G)-Direct Plan | 2.9245 | 20.5368 |
| HDFC Multi-Asset Fund(G)-Direct Plan | 1.5517 | 16.1420 |
| SBI Multi Asset Allocation Fund(G)-Direct Plan | 1.3203 | 12.7931 |
| Multi-asset index | 1.60% | 15.96% |
| Motilal Oswal Multi Asset Fund(G)-Direct Plan | -0.3066 | 3.9277 |
| UTI Multi Asset Fund(G)-Direct Plan | -0.3203 | 10.5035 |
| Nippon India Multi-Asset Fund(G)-Direct Plan | -2.2808 | 14.9084 |
| NIFTY 50 – TRI | -5.0062 | 21.3530 |
| Axis Triple Advantage Fund(G)-Direct Plan | -7.5316 | 16.3259 |
| Fund/Index | 3 Years | 4 Years |
| Quant Multi Asset Fund(G)-Direct Plan | 30.8192 | 25.0927 |
| ICICI Pru Multi-Asset Fund(G)-Direct Plan | 20.5419 | 16.4070 |
| NIFTY 50 – TRI | 16.2295 | 14.5419 |
| HDFC Multi-Asset Fund(G)-Direct Plan | 15.9237 | 13.7673 |
| Axis Triple Advantage Fund(G)-Direct Plan | 13.9515 | 14.6737 |
| SBI Multi Asset Allocation Fund(G)-Direct Plan | 11.9091 | 11.3590 |
| UTI Multi Asset Fund(G)-Direct Plan | 10.3899 | 8.5037 |
| Multi-asset index | 14.58% | 13.93% |
It is too early to judge these funds as the history is too short, as we cannot run a rolling returns analysis. It would be great if SEBI mandates the disclosure of respective benchmark data so that each fund can be analysed in detail.