Last Updated on March 19, 2016 at 8:31 am
Do past returns matter? Does it make any sense to choose a mutual fund that has performed consistently in the past? After all, there is no guarantee that it would continue to perform well in future.
Let us try out a simple exercise.
- Download returns data from Value Research Online of all equity funds currently open for subscription, except direct funds.
- Plot the 10-year returns (distant past) of all funds against their 3/5/1-year (recent past) returns and visually observe correlations.
The idea is to determine the extent of correlation between a funds 10-year trailing return with its 5/3/1-year trailing return.
If there is a strong correlation, then choosing a fund with impressive ‘history’ makes perfect sense. If there is no correlation, there is no point relying on past performance.
🔥Secure your future with our Robo-advisory tool trusted by over 3,500 investors and advisors. From effortless retirement planning to funding your children’s biggest dreams, turn your financial goals into reality. 🔥
Subscribe for money management solutions via email! (Link takes you to our email sign-up form) Join 32,000+ readers in our community.
👉 New Tool Alert! NaviPlan: A Privacy-Focused Multi-asset Tracker and Goal Planner 👈
Since life is more of grey than black or white, even before we start, we should expect the correlation to be neither be too strong nor to weak!
While the idea lacks sophistication, I think that it is good enough for the retail investor to check how return from an investment made in the distant past correlates with the return from an investment made in the recent past
Before we begin, let us bear in mind that we are working with trailing returns which means the returns will change from day to day. The data here is as on 11th July 2014.
So here goes nothing
3-year vs. 5-year returns
Let us start with 3-year versus 5-year returns as it is the simplest to understand.
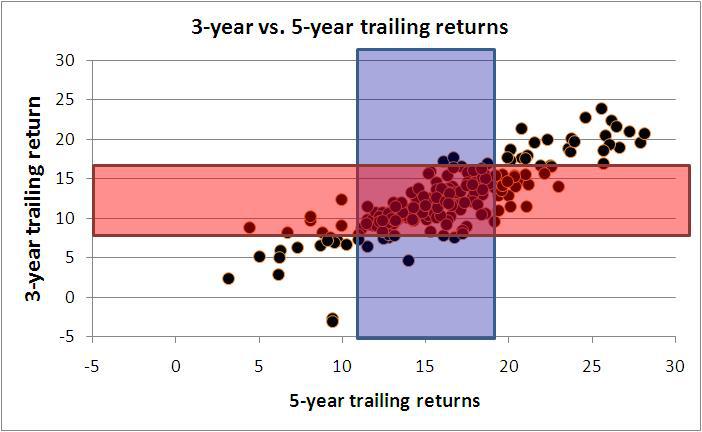
Each point in the graph represents a different mutual fund.
Notice the linear correlation. A higher 5-year trailing returns implies an higher average 3-year trailing return.
‘Average’ because for a single 5-Y return, multiple 3-Y returns are possible.
The blue rectangle represents all the 5-Y returns within one standard deviation of the mean.
That is the mean 5-Y return is 16%. The standard deviation (measure of deviation from the mean) is 4.5%. So the rectangle approximately extends from (16%-4.5%) to (16%+4.5%)
Similarly, the red rectangle represents all the 3-Y returns within one standard deviation of the mean.
Notice that most of the points (funds) are found at the intersection of the two rectangles: a good 67% of the funds.
If you had chosen funds with high 5-year correlation, to the right of the blue rectangle, the 3-year return would either be within the red rectangle or above it. Not bad at all.
Thus one could conclude that there is pretty decent correlation between 3-Y and 5-Y trailing returns. Decent performers in one category are like be decent performers in the other.
5-year vs. 10-year returns
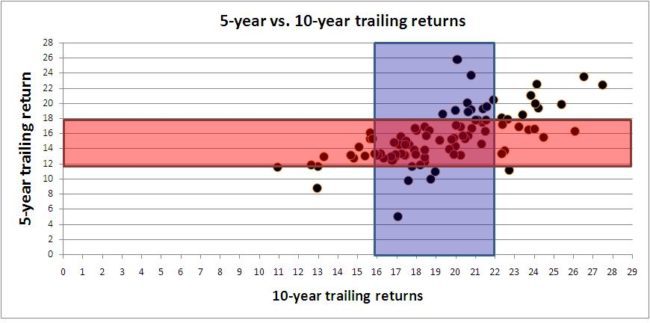
Notice that correlation has visually reduced significantly. For a given 10-year return within the blue rectangle, the 5-year return can vary by a much wider margin than the 3Y-5Y graph.
In spite of this, a good 55% of the funds can be found in the intersection between the two rectangles (that is within one standard deviation of the mean)
This means if your fund had 5-Y return within one standard deviation of the mean 5-Y return of all equity funds, there is a good chance that it will be found within one standard deviation of the mean 3-Y return.
If you had have chosen funds with high 10-year trailing returns, to the right of the blue box, you would have got a 5-year return above or within the red rectangle (with the exception of one fund). Again, not bad at all, right?
Yes the correlation has decreased and there is a huge spread in returns but the spread is still favourable. Most of the funds either are above average or close enough to the average.
3-year vs. 10-year returns
The spread (range of 3-Y returns for a single 10-Y return) has widened further.
However, still a good 56% in the intersection of the two rectangles.
A high10-Y return to the right of blue rectangle has resulted in a return that is either in the red rectangle or above it. Which is quite decent. A high 10-Y return has produced a high enough 3-Y return.
1-year vs. 10-year returns
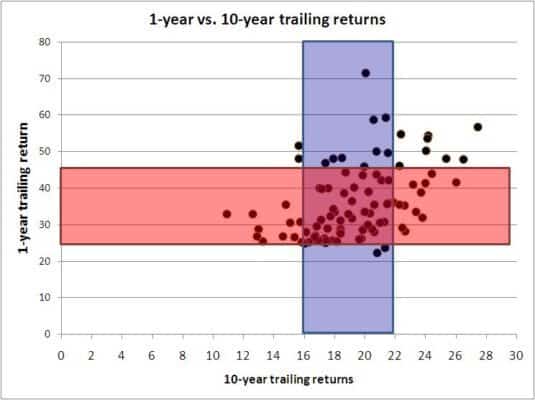
About 48% of funds found in the intersection of the rectangles.
The spread, especially within the blue rectangle has considerably increased, and thanks to the bull run, it is on the higher side. One should not take this graph too seriously and it can change a lot depending on when choose to plot the data.
Since we work with trailing returns, the same could perhaps be said of all of the above graphs.
That said, there appears to be a reasonable correlation between returns of the distant past and returns of the recent past.
To me, this is good enough to short-list consistent performers based on 3-year, 5-year and 10-year data listed by Value Research Online as explained in the step-by-step guide to choosing an equity mutual fund.
The past seems to be prologue.
If my definition of consistency is combined with reasonable return expectations (~ 10%), the chances of disappointment are significantly lowered.
Would you agree?
We are on Google News
Use this button to add freefincal.com as a preferred personal finance source on Google News.

Explore 1,400+ videos on YouTube!

Subscribe to get posts via email!
Join 32,000+ readers and get free money management solutions delivered to your inbox! (Link takes you to our email sign-up form)Join our WhatsApp Channel

Explore our products
🔥Join our community of 9000+ users! 🔥- Use our Robo-advisory Tool to create a complete financial plan! More than 3,500 investors and advisors use this! Use the discount code robo25 for 20% off. Plan your retirement (early, normal, before, and after), plus non-recurring financial goals (such as child education) and recurring financial goals (such as holidays and appliance purchases). The tool helps anyone aged 18 to 80 plan for retirement, plus six non-recurring and four recurring financial goals, with a detailed cash flow summary.
- Our Flagship Course! Learn to manage your portfolio like a pro to achieve your goals regardless of market conditions! More than 3,500 investors and advisors are part of our exclusive community! Get clarity on how to plan for your goals and achieve the necessary corpus no matter the market conditions! Watch the first lecture for free! One-time payment! No recurring fees! Lifelong access to videos! Reduce fear, uncertainty and doubt while investing! Learn how to plan for your goals before and after retirement with confidence.
- Join the freefincal investor circle! An exclusive space for investors, advisors, fintech employees and students to access financial planning and insurance tools, mutual fund and stock analysis tools, coding strategies and Excel macros for data extraction. 750+ members are now part of our investor circle.
- Increase your income by getting people to pay for your skills! More than 900 salaried employees, entrepreneurs and financial advisors are part of our exclusive community! Learn how to get people to pay for your skills! Whether you are a professional or small business owner seeking more clients through online visibility, or a salaried individual looking for side or passive income, we will show you how to do it by showcasing your skills and building a community that trusts and pays you. (Watch the 1st lecture for free). One-time payment! No recurring fees! Lifelong access to videos!
- Portfolio Tracker! Track your mutual funds and stock investments with our Google Sheet!
- We also publish monthly screeners for
Our Podcast: Let's Get Rich With Pattu
On Spotify: Let's Get RICH With PATTU! Every single Indian CAN grow their wealth! On Audible: Listen to the Let's Get Rich with Pattu Podcast

Listen to the Let's Get Rich With Pattu podcast on YouTube.
Now watch Let's Get Rich With Pattu தமிழில் (in Tamil)!About The Author

Dr M Pattabiraman giving a lecture
- Dr M. Pattabiraman (PhD) is the founder, managing editor and primary author of freefincal. He is an associate professor at the Indian Institute of Technology, Madras.
- He has over 14 years of experience publishing news analysis, research and financial product development. He has over 28 years of teaching and research experience. He is also a public speaker and keynote presenter.
- He is a patron and co-founder of “Fee-only India,” an organisation promoting unbiased, commission-free, AUM-independent investment advice.
- Connect with him via @pattufreefincal on X LinkedIn YouTube
- Pattabiraman has co-authored three print books.
This book helps you ask the right questions and find the right answers. It also includes nine online calculators to create custom solutions.
(2) Gamechanger: Forget Startups, Join Corporate & Still Live the Rich Life You Want. This book helps young earners get the basics right from the start! It will also help you travel to exotic places at a low cost! (3) Chinchu Gets a Superpower! for kids.Both the boy and girl versions of "Chinchu Gets a Superpower".
Most investor problems stem from a lack of poor decision-making. We made bad decisions and money mistakes when we started earning, and we spent years undoing them. Why should our children go through the same pain? What is this book about? As parents, what if we had to groom one ability in our children that matters not only for money management and investing but for every aspect of life? My answer: Sound decision-making. So, in this book, we meet Chinchu, who is about to turn 10. The story follows what he wants for his birthday and how his parents plan it, while also teaching him key ideas about decision-making and money management. What readers say!Feedback from a young reader after reading Chinchu Gets a Superpower!
Must-read book even for adults! This is something that every parent should teach their kids right from a young age. The importance of money management and decision-making based on their wants and needs. Very nicely written in simple terms. - Arun.
About freefincal & its content policy
Freefincal is a News Media organisation dedicated to providing original analysis, reports, reviews and insights on mutual funds, stocks, investing, retirement and personal finance developments. We do so without conflict of interest and bias. Follow us on Google News. Freefincal serves more than three million readers a year (5 million page views) with articles based only on factual information and detailed analysis by its authors. All statements made will be verified with credible and knowledgeable sources before publication. Freefincal does not publish paid articles, promotions, PR, satire or opinions without data. All opinions will be inferences backed by verifiable, reproducible evidence/data. Contact Information: To get in touch, please use our contact form. (Sponsored posts or paid collaborations will not be entertained.)Our publications
- Your Ultimate Guide to Travel. This is an in-depth exploration of vacation planning, including how to find affordable flights, budget accommodations, and practical travel tips. It also examines the benefits of travelling slowly, both financially and psychologically, with links to relevant web pages and guidance at every step. Get the PDF for Rs 300 (instant download)
- How to profit from content writing: Our ebook is for those interested in getting a side income via content writing. It is available at a 50% discount for Rs. 500 only!