A reader asks, “I cannot decide between Nippon India Nifty 50 Bees ETF and UTI Nifty 50 Index Fund. The ETF has a total expense ratio of 0.05%, while the index fund’s TER is 0.2%. My friends tell me that ETF is bound to outperform the index fund over the long term and that choosing the ETF is a no-brainer. However, you repeatedly keep asking us to avoid ETFs. Can you please advise what to do?”
Your question reminds me of a line from the movie the Prestige. Hugh Jackman’s character says, “price is not an object.” David Bowie’s character (Nikola Tesla) responds, “Perhaps not, but have you considered the cost?” Yes, the price of investing in an ETF is much lower than that of an index fund, but what about the cost?
Unlike an index fund, an ETF trades like a stock (only high-net-worth individuals can buy and sell off the market). Therefore the NAV of an ETF is not relevant for tracking errors or returns. Only the market price matters.
The price of an ETF should ideally follow the NAV of an ETF. It can trade above/below the NAV for a few days, but an AMC-authorized participant reduces this difference via arbitrage.
However, when there is a supply-demand mismatch due to sudden positive or negative developments, the ETF price can significantly deviate from the NAV. The true cost of investing in an ETF is this price-NAV deviation.
🔥Secure your future with our Robo-advisory tool trusted by over 3,500 investors and advisors. From effortless retirement planning to funding your children’s biggest dreams, turn your financial goals into reality. 🔥
Subscribe for money management solutions via email! (Link takes you to our email sign-up form) Join 32,000+ readers in our community.
👉 New Tool Alert! NaviPlan: A Privacy-Focused Multi-asset Tracker and Goal Planner 👈
Very few ETFs in India consistently keep this NAV-price deviation in check. Very few ETFs in India see active trading. A large AUM or active trading are not prerequisites for low-NAV price deviations.
- Nippon India Nifty 50 Bees ETF is one of the best ETFs in the country. Source: ETF tracking error screener.
- UTI Nifty 50 Index Fund Direct Plan, Growth option is one of the best index funds in the country. Source: Index fund tracking error screener.
If we compare the price of Nifty Bees (not NAV, never NAV!) with UTI Nifty, which would come out on top? Many would expect the ETF to win, but that is not necessarily the case.
Suppose a fund’s expense ratio is the only reason for deviating from the index, the tracking error will be zero. This is because a fixed amount is deducted from the NAV of the ETF/ index fund, and therefore the relative volatility wrt the benchmark is zero.
The main sources of tracking error in an index are the AUM in and outflow, the impact costs of stocks (buy vs sell price deviation when sold in bulk) and corporate actions of stocks (dividends, splits etc.) This is particularly notorious in small AUM index funds. See: These five index funds beat their indices! Why you should avoid them!
An ETF also suffers from all these issues. In addition, it suffers from demand vs supply in its investors’ pool. Then there is the authorized participant who would only efficiently reduce price-NAV deviation when there is enough arbitrage incentive.
Therefore even before we compare the returns, it is clear that an index fund is the simpler choice, but would the higher expense ratio makes a difference to the returns?
The 1y, 3Y and 5Y rolling returns based on ETF price and index fund NAV are shown below. The date range is from Aug 2nd 2016, to Sep 30th 2022.
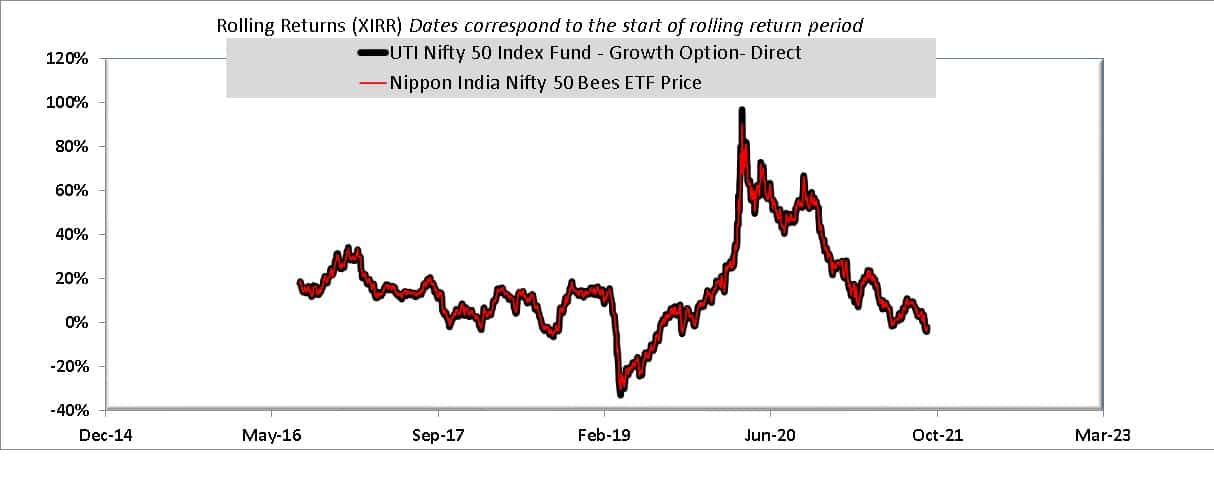
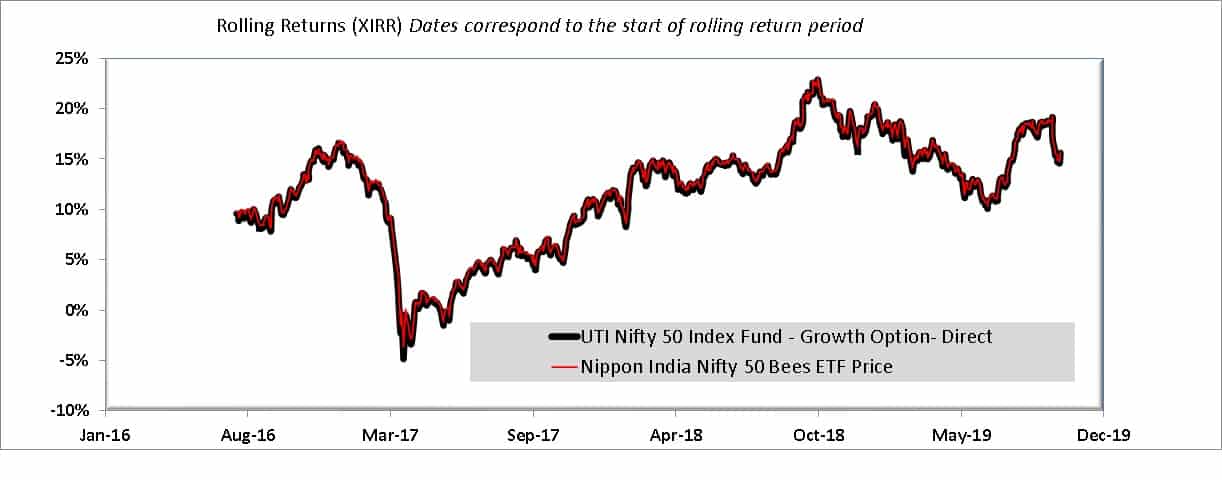
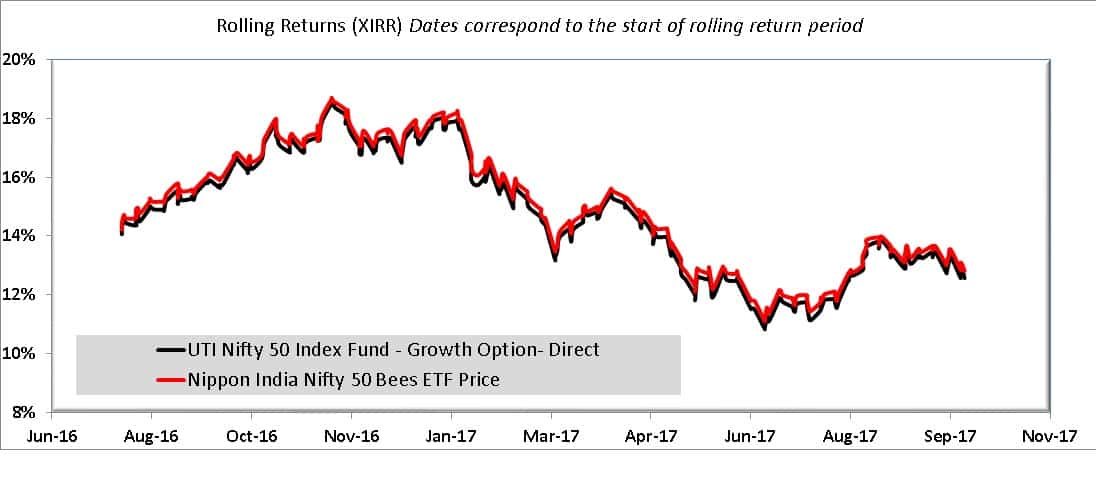
Over 1 and 3 years, the difference is negligible. Over five years, the ETF edges up with an average higher return of 0.24%. The median return is also the same (to two decimals). Please note that 5Y data is only over a year (see the range of the X-axis shrink from 1 to 5 years).
Assuming both passive funds are just as efficient in tracking the index (given their specific circumstances), the ETF has a small edge originating, possibly because of the higher expense ratio of the index fund. In May 2021, the UTI fund doubled its expense ratio from 0.1% in March 2021 to 0.2%. For its part, the ETF has had a steady expense ratio of 0.05% only from July 2019. Before that, it was as expensive as the UTI fund (0.1%); before May 2017, the ETF was more expensive.
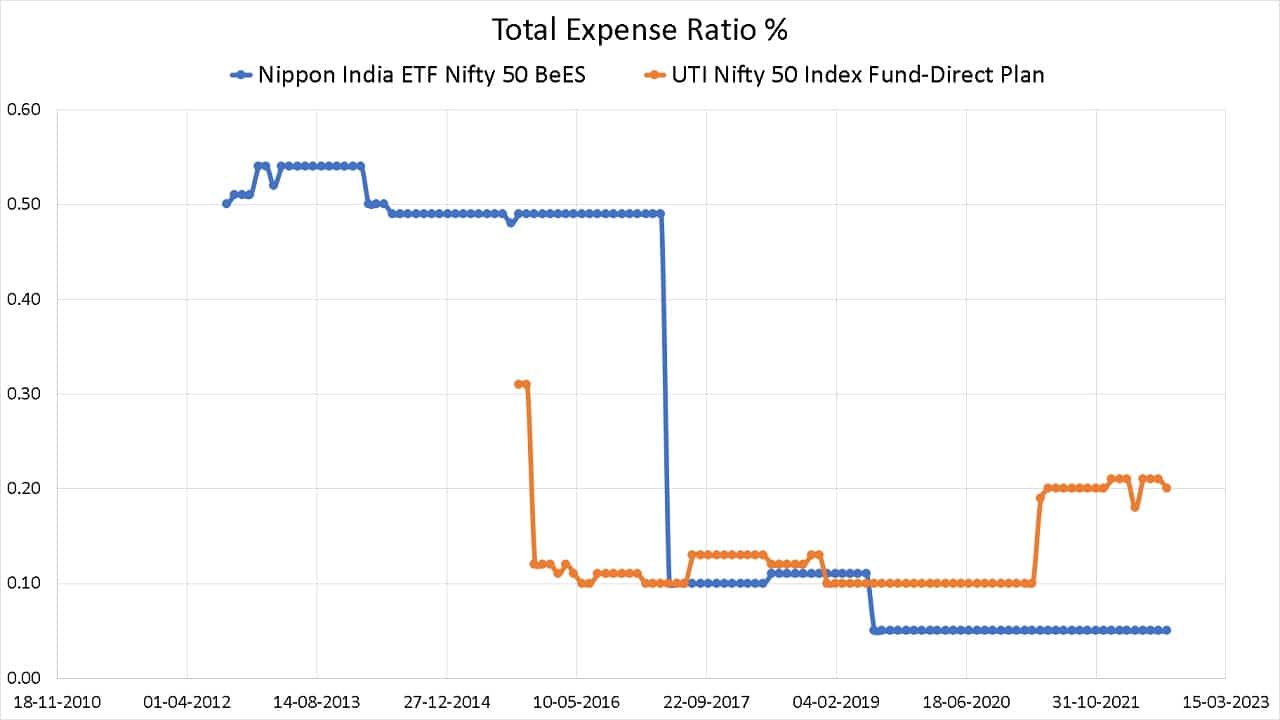
ETF or index fund, a simple thumb rule is when the expense ratio decreases, the fund house wants AUM and when it increases, the fund house wants to profit from the AUM increase and expects the inflow to be steady.
There is one catch to buying an ETF, though. A demat account is necessary, with its own one-time and recurring costs (brokerage and maintenance fee). So this would further narrow the gap in the five-year returns.
In summary, although Nippon India Nifty 50 Bees ETF is an excellent performer, the UTI Nifty 50 Index Fund is just as good and is the simpler choice for long-term investing. That said, experienced investors who can navigate the ETF price volatility can certainly consider Nifty Bees.