Last Updated on April 26, 2025 at 9:23 pm
In this guest post, R. Srivatsan discusses the pros and cons of using a stock valuation technique known as Earnings Power Box, introduced by Hewitt Heiserman, Jr, in his book, “It’s Earnings That Count: Finding Stocks with Earnings Power for Long-Term Profits”. Regular readers maybe aware that Srivatsan has already introduced the technique in his first post: It’s Earnings That Count: Forget the next Infy; Can you identify the next Satyam?. Since then he has come up with ways to automate the Earnings Power Box calculation using morningstar financials and then with screener.in financials.
This tool is now part of the freefincal investor circle.
Earnings Power Box
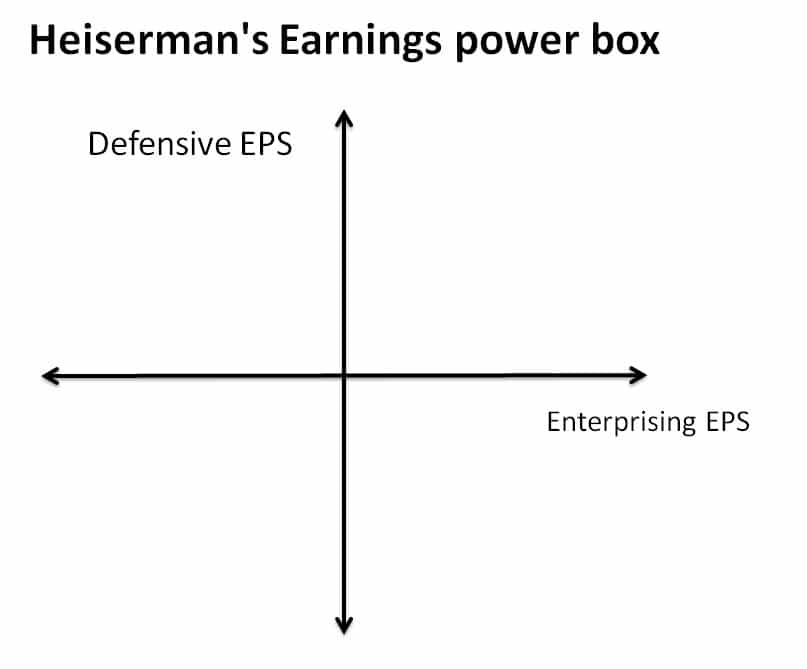
This is a plot of two the Defensive EPS (earnings per share) vs Enterprising EPS
🔥Secure your future with our Robo-advisory tool trusted by over 3,500 investors and advisors. From effortless retirement planning to funding your children’s biggest dreams, turn your financial goals into reality. 🔥
Subscribe for money management solutions via email! (Link takes you to our email sign-up form) Join 32,000+ readers in our community.
👉 New Tool Alert! NaviPlan: A Privacy-Focused Multi-asset Tracker and Goal Planner 👈
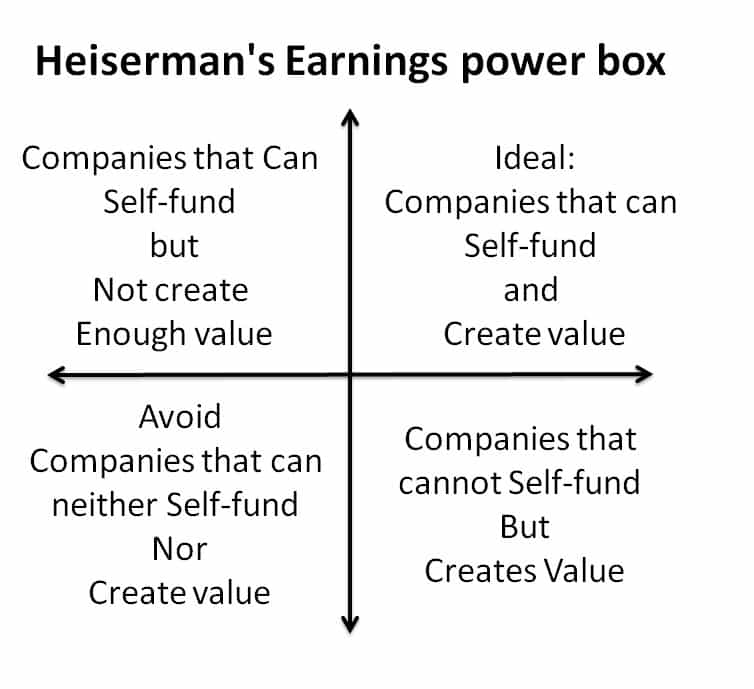
The idea is to spot where a company falls in.
This is based on: Earnings Power Valuation ModelOpens in a new window (doc file).
If this is new to you, before reading about the pros and cons, I strongly suggest that you head to the fantastic slideshow prepared by Srivatsan and then come back here.
Earnings power box – the nitty gritty stuff
Here are my 5 take-aways on reading Hewitt Heiserman’s book. All my points are with reference to the figure below:

I This tool is NOT for identifying the next multi-bagger. This is a great tool for identifying what I call the MULTI-BEGGARS.
- I am an ignoramus when it comes to direct stock investing (among several other things). I am worried about making too many blunders. Given my personal biases and risk tolerances, this is a great tool for me to know WHERE NOT TO PUMP my hard earned money
- Anything in Quadrant #3 is a straight reject
- To merit a second thought, the company has to be the bare minimum in Quadrant #2. Quadrant #4 is really a judgment call. I will not touch it though
II The concept and framework is amazingly simple yet brilliantly profound.
- Any business that generates free cash flow (FCF) and Returns above the cost of capital (ROIC) year after year is a great business. That’s it. This is true for a roadside petty shop or a Fortune 500 company
- Forget about the durability of moats, sustainable competitive advantage, intelligent fanatics, latticework of mentals and their models. Proof of the pudding is in the eating. All these should result in FCF and superior ROIC; If not, it is a great dog and pony show
- View these two metrics as two eyes of any business. My preference is to have two eyes although you can comfortably manage with one eye. I definitely do not want to go blind
III Complete Disconnect from market behaviour / psychology – a boon or bane?
- Use this tool IF and ONLY IF
- You are a brutally rational and unemotional investor
- You like to take few concentrated bets with huge payoffs
- You really would like to follow Buffettisms (of owning few great businesses) and not parrot them mindlessly
- Great stocks can and will be found in ALL 4 quadrants. Can you really stick to your guns of investing only in businesses of Quadrant #1?
- I mean, you should be like Boman Irani’s hand in Munna Bhai MBBS. Now can you do it? Even Boman Irani says his hand will shake while operating on his daughter
- Over the last two years, I have seen stocks in Quadrant 3 zoom 2x, 3x, 5x or even more and there are no words in English language to describe that burning feelingJ. Can you sit quietly during this period knowing that the business is a trap while everyone at your office is bragging during coffee breaks?
IV Makes entry / exit decisions a lot easier
- When to buy – When the company first enters Quadrant #1. This makes sense because it means that for the first time, the business has started to be self-sufficient and grow and hence can be expected to start compounding returns
- When to sell – When the company is no longer in Quadrant #1 and begins to drift to other quadrants. Again, this makes sense because, for whatever reason, business is facing headwinds and is no longer able to sustain the cash flows or returns (or both)
V Makes Annual stock portfolio review a lot easier
You can use this tool to:
- Assess where the stocks in your portfolio currently stand in the earnings power box
- How their business performance are trending year after year
- Buy more or liquidate positions accordingly
CAVEATS on the Concept and the Automated Analyzer (Morningstar and Screener versions)
- Heiserman’s Earnings that count approach is just one way of evaluating a business among millions of approaches / models / frameworks. It is NOT a silver bullet
- This tool will be useful for a subset of investors (for example with limited knowledge level, time, energy, interest and low risk tolerances) and not everyone
- The tool assumes availability ten years’ of reliable and authentic financial statements
- This will be clear when we see some pros and cons of using Morningstar and Screener
| Morningstar | |
| Advantage | Disadvantage |
| Reports Capex exactly like Annual report | Provides only consolidated data |
| Reports FCF directly | No Depreciation, Other income values |
| Reports Balance sheet as % and not as actual values | |
| Missing data for some companies and some years | |
| Screener | |
| Advantage | Disadvantage |
| Reports Other income, Balance sheet values | No Capex, Working capital, FCF data |
| Provides both standalone and consolidated data | Does not follow standard reporting format |
- If you notice carefully, to use Heiserman’s calculation, one needs Capex, Working Capital, Other income, and Balance sheet values. Neither screener nor Morningstar provide ALL the values. One has to do derive the missing quantities or modify our calculations to the available data.
- Of course, you can do all these calculations from the ten annual reports of the company J
- Please note that the following are ignored in the automated tool calculations. The error of omission is assumed to be not so significant to be detrimental to the final conclusions.
- R&D expenses (no data)
- Deferred tax assets and liabilities (confusing calculations and inconsistent reporting)
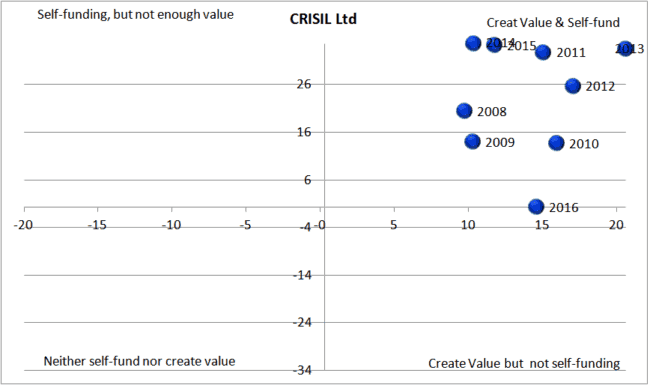
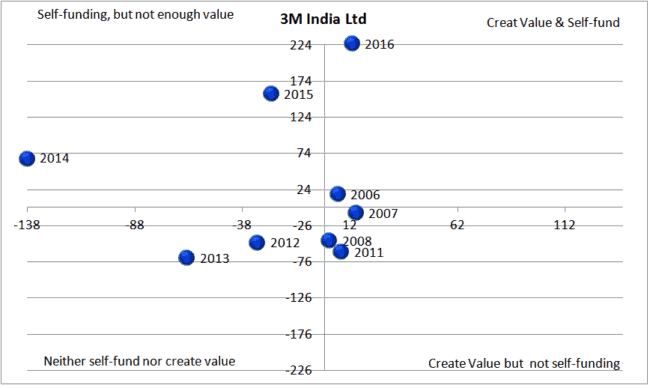
Gallery (created with MorningStar financials)
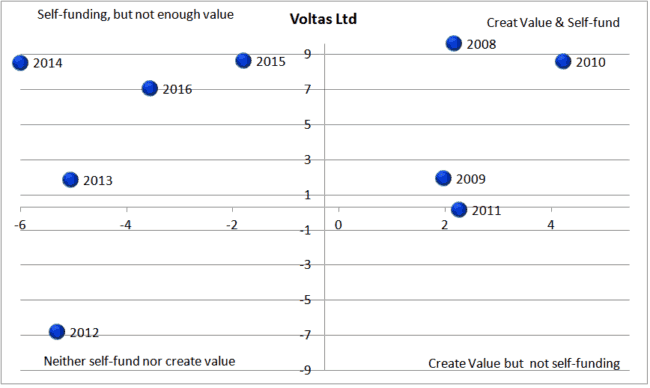
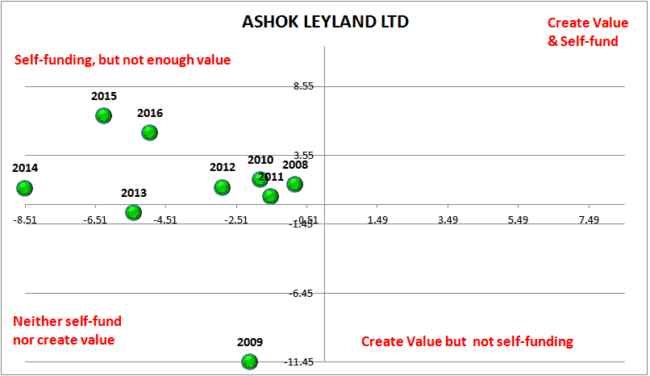
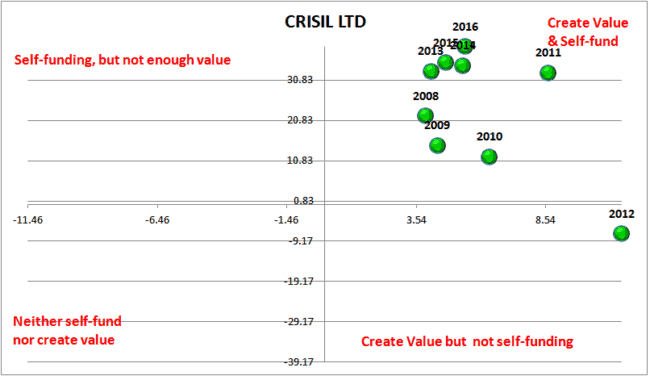
Gallery (created with screener.in financials)
This tool is now part of the freefincal investor circle.