Last Updated on December 29, 2021 at 5:23 pm
Sensex closed today (28th Feb 2020) at 38,297.29 which is 3.64% lower than yesterday. This means 12 negative daily returns out of the last 15-day window. This (12/15) is the third-longest losing streak over this window in the history of the Sensex. If the Sensex heads South next week, more records could be equalled (hopefully not broken)!
From April 1979, if we study the number of negative daily returns over a rolling 15-day window, there has been at least one negative daily return ( red day) in every possible window (9411). This means the Sensex has never moved up for 15 days straight!
- Two red days (2/15): 9401/9411
- Three red days (3/15): 9315
- Four red days: 8966
- Five red days: 8264
- Six red days: 7160
- Seven red days: 5718
- Eight red days: 4508
- Nine red days: 2523
- Ten red days: 1299
- Eleven red days: 479
- Twelve red days: 120
- Thirteen red days: 18
- Fourteen red days: 1
- Fifteen red days: 0
This is shown graphically below in log scale to highlight the “knee point” which occurs around 8/9 red days. The frequency of 9/15 red days is 44% lower than 8/15 red days! The frequency of 10/15 red days is 48% lower than 9/15 red-days and 71% lower than 8/15 red days. This means the stock market does not run away up or down in an uncontrolled manner. Frequent and infrequent trading prevents this from happening.
🔥Secure your future with our Robo-advisory tool trusted by over 3,500 investors and advisors. From effortless retirement planning to funding your children’s biggest dreams, turn your financial goals into reality. 🔥
Subscribe for money management solutions via email! (Link takes you to our email sign-up form) Join 32,000+ readers in our community.
👉 New Tool Alert! NaviPlan: A Privacy-Focused Multi-asset Tracker and Goal Planner 👈
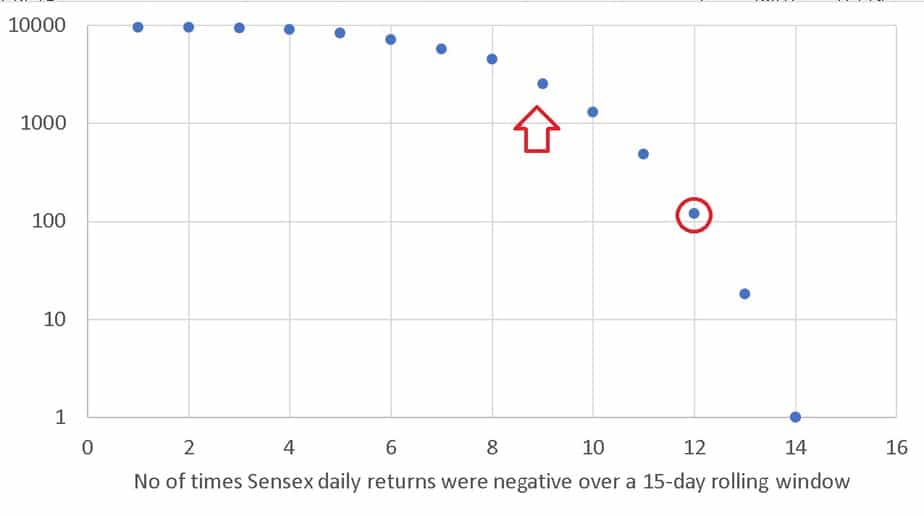
In the featured image above, you can see the number of 12 red days since 1st Jan 2012. Today (28th Feb 2020) is the 26th such instance. We last saw this in May 2019
Notice from the listing above, we have seen 120 such 12/15 streaks but only eighteen 13/15 streaks and just one 14/15 occurrence! If the markets continue to fall on Monday (2nd March) and Tuesday and Wednesday then it would be 13 red days out of 15. The last such instance was in May 2019 and Nov 2015 prior to that.
If the Sensex also falls on Thursday (March 5th) it would me 14/15 – the only second instance! The longest losing streak was between 28th Aug 2001 to 17th Sep 2001 when the Sensex fell from 3313 to 2681.
Those with enough money in the market would not want a repeat of that, while those who have just begun their investment journey would naively look forward to it.
It should be noted that 12/15 red days is significantly more common than 13/15 (almost seven times more). So although it may not seem like much of a step up, it is a significant climb (thankfully!)
What should investors do? Those who already have an asset allocation strategy in place for specific goals in minds have nothing to do! Those part of the goal-based portfolio management group would also know how to handle adverse return sequences.
Those who practice a specific tactical asset allocation strategy would also know what to do. Those who do not have a plan can either create one for themselves, get paid help from our list of SEBI registered fee-only advisors or forever remain confused!