Last Updated on December 29, 2021 at 5:23 pm
On this “extra day” in February which will endow 2020 with 366 days, let us find out how the Sensex and the S & P 500 have changed from one leap year to another and what it can teach us about risk and reward.
On 29th Feb 1980, the Sensex closed at 128.21. Forty years on, it closed at 38,297.29 on 28th Feb 2020. Almost 300 times more and an annualized growth of 15% excluding dividends. The data in the image above is shown below.
Sensex growth between leap years
| Date | Sensex (price) |
| 29-02-1980 | 128.21 |
| 29-02-1984 | 250.47 |
| 29-02-1988 | 411.22 |
| 29-02-1992 | 3017.68 |
| 29-02-1996 | 3391.99 |
| 29-02-2000 | 5446.98 |
| 27-02-2004 | 5667.51 |
| 29-02-2008 | 17578.72 |
| 29-02-2012 | 17752.68 |
| 29-02-2016 | 23002.00 |
| 28-02-2020 | 38297.29 |
This is the leap year to leap year annualized returns.
🔥Secure your future with our Robo-advisory tool trusted by over 3,500 investors and advisors. From effortless retirement planning to funding your children’s biggest dreams, turn your financial goals into reality. 🔥
Subscribe for money management solutions via email! (Link takes you to our email sign-up form) Join 32,000+ readers in our community.
👉 New Tool Alert! NaviPlan: A Privacy-Focused Multi-asset Tracker and Goal Planner 👈
| Date | Annualized Return |
| 29-02-1980 | |
| 29-02-1984 | 18% |
| 29-02-1988 | 13% |
| 29-02-1992 | 65% |
| 29-02-1996 | 3% |
| 29-02-2000 | 13% |
| 27-02-2004 | 1% |
| 29-02-2008 | 33% |
| 29-02-2012 | 0% |
| 29-02-2016 | 7% |
| 28-02-2020 | 14% |
The 65% window is due to Harshad Mehta related market manipulation. Even in such a short period, we notice multiple single-digit returns. With the exception of 7%, the addition of 1.5% to 2% from dividends will still not be able to beat inflation or fixed deposits.
The argument that “four years is too short” will not help much as risk does not die down in the long term as shown earlier: Dollar Cost Averaging aka SIP analysis of S&P 500 and BSE Sensex and Ten-year Nifty SIP returns have reduced by almost 50%
Merely 11 data points spaced four years apart is enough to highlight the nature of the stock market. Returns and losses are clumped. A big positive return leads to a slowdown and then a big up move, what we refer to as the Sensex Staircase – are you ready to climb?!
You can also imagine in which window the mutual fund industry started to grow rapidly (post-2016) and when it faced a slowdown (2008-2012). Distributors will have you believe that “hand-hold” investors during tough times. There is no evidence of that.
People stop investing during tough times or are not interested in the stock market just when they should be pouring in money! No advisor, whether distributor or RIA can help investors manage risk unless the investors themselves are mature and invest with a clear goal.
S&P 500 growth between leap years
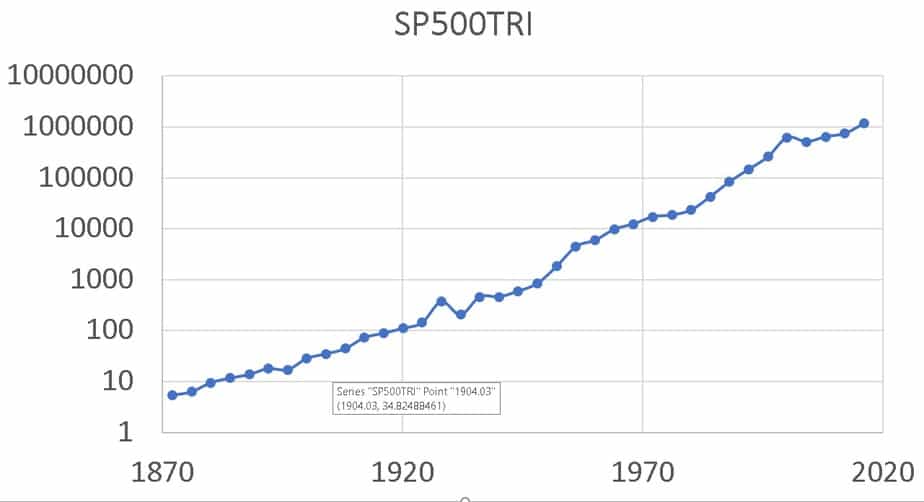
The S&P 500 offers a much longer history to study leap year movements. Thanks to Prof. Schiller, one can get monthly S& P 500 data including dividends from 1872! Or 37 leap years! This data is inflation-adjusted but for this study, we shall only consider total returns (dividends assumed to be reinvested).
Amusingly the S&P 500 “looks” fairly calm from leap year to leap year (most US presidential elections fall on a leap year) in log scale.
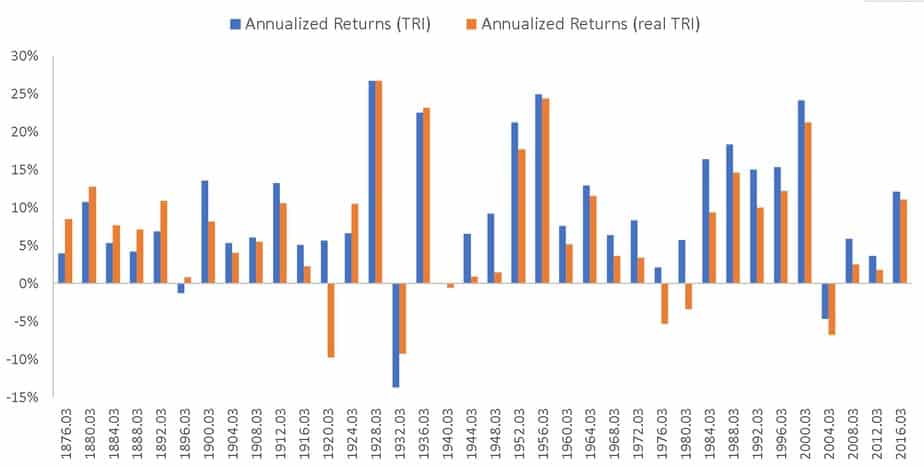
The returns, however, paint a different picture. The periods of severe recession and unemployment are clearly seen from the real (inflation-adjusted) returns.
Just like the cricket or football world cup, a leap is a wonderful life market. Four years ago, in Feb 2016, there was no GST and an Rs. 1000 note was still legal tender! It seems like a short span but many events unfold from one leap year to the next. How was your investment portfolio four years ago? Do you think you manage money better now?
How will the Indian economy evolve in the next four years? How will our portfolios evolve? We will have to wait for the arrow of time to move forward.