Last Updated on December 29, 2021 at 5:13 pm
What return can I expect from a SIP in an equity mutual fund is a question that new investors commonly ask. It would take them some time and some capital loss to understand that one should not expect returns from mutual fund SIPs, but must do this instead! An analysis of NIfty TRI (dividends included) from July 1999 shows that 10 and 15-year SIPs have continuously decreased. A look at how investors should redefine their expectations and plans.
Kindly note that this analysis is not about active vs passive investing. If a SIP in NIfty has returned lesser and lesser over time, the fate of active mutual funds (with a long enough history) would be no different. See for example Franklin India Bluechip Fund has not beaten the Nifty for the last 11 years! Also: Rolling SIP Return Analysis: Franklin India Blue Chip Fund.
Before we begin, as announced on Youtube, a video lecture series on Goal-Based Portfolio Management: Techniques to reduce fear, uncertainty, & doubt will be launched soon. This will discuss strategies to use and manage the right asset allocation no matter what the market condition is. You can register via this Googe Forms link for a notification upon launch. Note: the course is not about mutual funds or stocks. It is about goal-based investing and asset allocation for DIY investors ready to take it to the next level.
🔥Secure your future with our Robo-advisory tool trusted by over 3,500 investors and advisors. From effortless retirement planning to funding your children’s biggest dreams, turn your financial goals into reality. 🔥
Subscribe for money management solutions via email! (Link takes you to our email sign-up form) Join 32,000+ readers in our community.
👉 New Tool Alert! NaviPlan: A Privacy-Focused Multi-asset Tracker and Goal Planner 👈
The results presented here are derived from this tool: Mutual Fund SIP Rolling Returns Calculator. The mutual fund industry has successfully created the illusion a mutual fund SIP will reduce risk, it will always remain profitable over the long term, and it will promote discipline.
We have previously shown none of these is true!
- Mutual Fund SIPs Do Not Reduce Risk! Beware of Misinformation
- How the fate of your mutual fund SIPs is decided by timing luck
- Huge difference in SIP returns from the same fund! How is it possible?
- Don’t get fooled: Mutual funds have no compounding benefit!
- How investors get fooled into buying mutual funds with wrong expectations
- Don’t Be Fooled: SIP is NOT systematic investing!
Since it is hard to compute returns from SIPs of the same duration but started on different dates, it was difficult for the retail investor to check the claims of the industry (or at least their salesmen) that a long term SIP cannot fail.
The only reason Indian markets give positive returns in a long-term SIP backtest is because of short historical data. Nifty TRI is available only from 30th June 1999. Sensex TRI daily data is available only for the last ten years trailing the US S&P website. The history for our midcap and smallcap indices is even shorter!
This makes it hard for analysts or DIYs to showcase the true risks associated with SIPs. Hence the need to resort to S& P 500: Dollar Cost Averaging aka SIP analysis of S&P 500 and BSE Sensex.
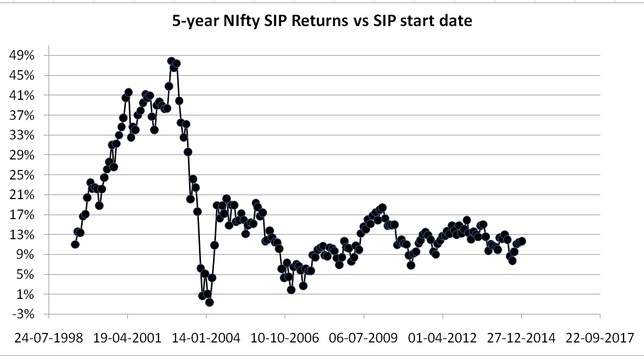
Let us now consider 5, 10 and 15-year rolling SIP returns data of the NIfty 50 TRI from 1st July 1999 to 1st Jan 2020. This is a span of merely 247 months. This is an example of a rolling five-year SIP study:
Start Date: 01-07-1999 End Date: 01-07-2004 XIRR: 11.01%
Start Date: 02-08-1999 End Date: 02-08-2004 XIRR: 13.48%
Start Date: 01-09-1999 End Date: 01-09-2004 XIRR: 13.30%
XIRR here is the internal rate of return or the annualized return. This is a simple introduction for new investors: What is XIRR: A simple introduction. Notice the start date is rolled over by one month to compute the new return. Just a one month difference in start date results in a 2% difference in XIRR! There are 187 five-year Nifty SIP returns.
Five-year Rolling Nifty SIP Returns
Over five years returns are pretty much anyone’s guess.
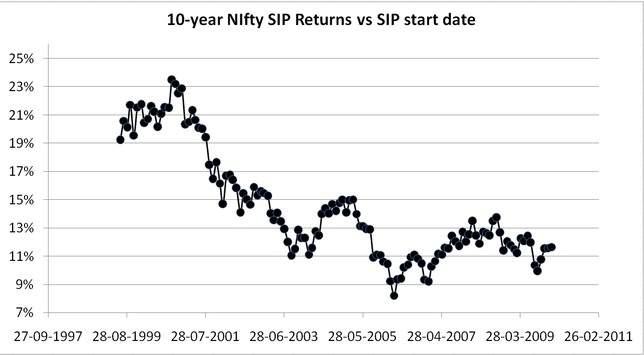
Ten-year Rolling Nifty SIP Returns
Notice the drop in returns from 20%-plus to 10%-plus. That is a fall of about 50% from 2009 to 2020.
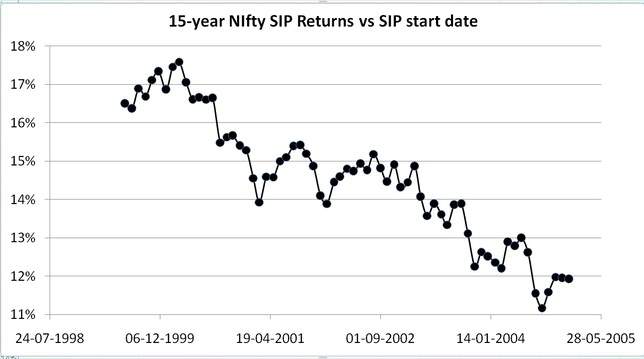
Fifteen-Year Rolling Nifty SIP Returns
The fall here is about 25% but steadier!
What do these results mean?
The constantly changing market dynamics is clearly evident here. We earlier saw this while analysing the Nifty PE using the market valuation tool. Notice how the long term PE average (central line) has moved up forcing us to redefine a high and low PE.
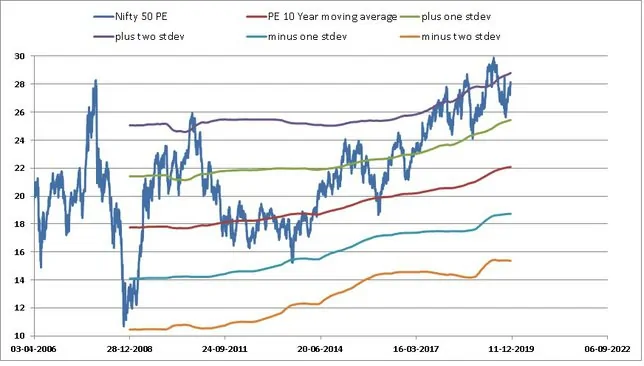
The NIfty has and is continuously changing character. The argument of a short history is applicable to the fall in returns as well. That is, one could argue that returns from Nifty could increase in future. However, a prudent investor would err on the side of caution and assume a trend reversal is not possible.
What should Investors do?
As the officially reported inflation decreases, interest rates follow, a decrease in stock market returns is natural and healthy. A lower expectation from equity is, in general, safer for investors, as they do not have to take too much risk or actively churn the portfolio due to underperformance.
However, the problem is not with the returns, the problem is with the asset allocation. Investors need to have at least 60% in equity for long term (ten-plus) year goals – at least initially.
Sadly this is not the case for many mutual fund and stock investors. Lower future returns and lower weights is a guarantee to a lower corpus. Investors should rework their asset allocation and goal calculations with not more than 10% returns from their overall equity portfolio (before tax – this will take away close to 1%).