Last Updated on December 29, 2021 at 5:48 pm
It is well known that stock market returns are clumped: it will rain returns in a big way followed by years of frustration. In this article, we investigate the annual and monthly returns of the Sensex from April 1979 and show the annualized return after 41 years depend on just a few good years/months.
All the returns mentioned in this article are price returns. Over the last 41 years, dividend income would be significant and approximately 2% to 2.5% above the price return. However, the absence of total returns will not dilute the central result in any way.
On 3rd April 1979, the Sensex price was 124.15 (this is by back-calculation, actual trading began only in 1986). On 1st April 2020, after 41 years, the Sensex price closed at 28265.31. This represents an annualized return (CAGR) of 14.16%. Include dividends and the return would be well above 16%. As on 1st Oct 2020, the return is 14.84% before dividends.
We can deconstruct the return from April 1979 to April 2020 using annual returns. For example, the return from April 1979 to April 1980 is 3.5% The return from April 1980 to April 1981 is 35.25% and so. The full list of such return is given below. The current article is an extension of this earlier study done in June 2013: Understanding the Nature of Stock Market Returns
🔥Secure your future with our Robo-advisory tool trusted by over 3,500 investors and advisors. From effortless retirement planning to funding your children’s biggest dreams, turn your financial goals into reality. 🔥
Subscribe for money management solutions via email! (Link takes you to our email sign-up form) Join 32,000+ readers in our community.
👉 New Tool Alert! NaviPlan: A Privacy-Focused Multi-asset Tracker and Goal Planner 👈
Date Annual return
01-04-1980 3.50%
01-04-1981 35.25%
01-04-1982 27.12%
02-04-1983 -3.76%
03-04-1984 16.06%
01-04-1985 42.39%
01-04-1986 59.57%
01-04-1987 -8.95%
04-04-1988 -22.21%
03-04-1989 82.26%
02-04-1990 8.16%
01-04-1991 52.45%
02-04-1992 267.61%
02-04-1993 -47.32%
04-04-1994 63.57%
03-04-1995 -12.28%
02-04-1996 2.81%
01-04-1997 0.51%
01-04-1998 15.83%
01-04-1999 -7.14%
03-04-2000 37.07%
02-04-2001 -29.42%
01-04-2002 -1.85%
01-04-2003 -11.98%
01-04-2004 86.33%
01-04-2005 15.05%
03-04-2006 75.08%
02-04-2007 7.70%
01-04-2008 25.46%
01-04-2009 -36.63%
01-04-2010 78.68%
01-04-2011 9.77%
02-04-2012 -10.00%
01-04-2013 7.93%
01-04-2014 18.99%
01-04-2015 25.90%
01-04-2016 -10.58%
03-04-2017 18.36%
02-04-2018 11.18%
01-04-2019 16.89%
01-04-2020 -27.29%
The top five annual returns are
- 267.6% Harsha Mehta Scam (April 92)
- 86.3% 2000s bull run (April 2004)
- 82.3% (?) (April 1989)
- 78.7% April 2010 (financial crisis recovery)
- 75.1% 2000s bull run (April 2006)
- 63.6% (April 1994)
Out of these, 82.3%, 63.6%, 86.3% and 78.7% were “recoveries”. The preceding periods saw significant losses. If an investor had run away from the market after these losses, they would have missed these “big returns”.
To appreciate how much these returns influence the 41-year CAGR of 14.16%, let us set each return to zero. Of course, this is unnatural and impossible. This is done to only establish a simple point: (in the absence of a scam!) if we want the rainbow, we must put up with the rain.
Remove the gain from the Harshad Mehta scam – 267.6% and the CAGR would drop from 14.16% to 10.6%. This is disillusioning, to say the least. All these gains we dream of by looking at past performance stems largely from a scam.
Remove the top two returns, the 41Y (price) CAGR becomes 8.92%. Remove the top three and it is 7.34%; Thus three big up moves out of which the biggest was fraudulent account for more than half of the CAGR we compute today and dream about. Remove the five top moves, the 41Y CAGR is 3.15%
Now let us look at the top 50 monthly returns. Notice the relative vacuum in the last decade.
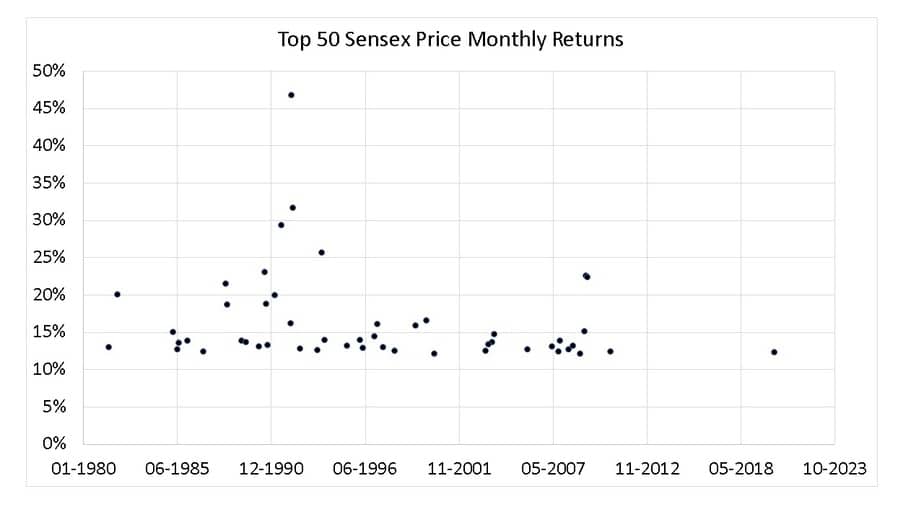
What do these results mean? These results are indeed disturbing but that is the nature of the market (scam included). Big returns either precede or succeed big losses. Those who the big returns “over the long terms” will have to stick around top face both the losses and gains.
Overall returns will depend on one or two big up moves. When this occurs, the investor must not only be invested but also be invested big. Post that, they should rebalance their portfolios to lock the gains in safe assets. If they leave the invested value to the mercy of the stock market, then the final result could well be disappointing: Ten-year Nifty SIP returns have reduced by almost 50%
Staying investing in the market is crucial for gains but overstay then it will be a case of “caramba! back to square one!”. This is the simple secret behind equity investing.