Last Updated on December 3, 2020 at 3:48 pm
Version 9 of the automated stock analysis sheet now projects expected earnings per share and calculates the forward PE. Some bugs have been corrected and minor improvements made.
List of features of the freefincal stock analyzer
The automated stock analysis sheet
- pulls financials from morningstar and analyzes them
- pulls adjusted stock price history from money control, and
- calculates intrinsic value six different ways!
It also pulls annual (standalone/consolidated) and quarterly financials from Value Research online. However, this is not used in any calculation.
Note: You need macros enabled. If it does not work from one network, try from another. It usually will not work if you try from your office.
🔥Secure your future with our Robo-advisory tool trusted by over 3,500 investors and advisors. From effortless retirement planning to funding your children’s biggest dreams, turn your financial goals into reality. 🔥
Subscribe for money management solutions via email! (Link takes you to our email sign-up form) Join 32,000+ readers in our community.
👉 New Tool Alert! NaviPlan: A Privacy-Focused Multi-asset Tracker and Goal Planner 👈
Valuation models available:
1) Price Multiple Model
2) Sustainable Growth Rate
3) Book Value Growth Rate (Buffett’s approach to valuation)
4) Discounted Cash Flow (DCF)
6) Graham formula and Graham number
All necessary links for learning each valuation model is provided in the Excel sheet itself. Following the flow of information in the sheet, a new investor should be able to understand how the valuation is done.
The sheet also calculates Piotroski Score for the last 9 financial years
Earnings Growth (EPS) Estimation
The earnings per share is projected with a simple linear fit in two ways: (1) using EPS vs year data and (2) using Log(EPS) vs year data. This is an extremely crude estimate and should be used with abundant caution.
The projected EPS can be used for calculated Forward PE. This is done in the price multiple model valuation sheet. A higher forward PE than current PE could indicate lower earnings in future (this is only a projection).
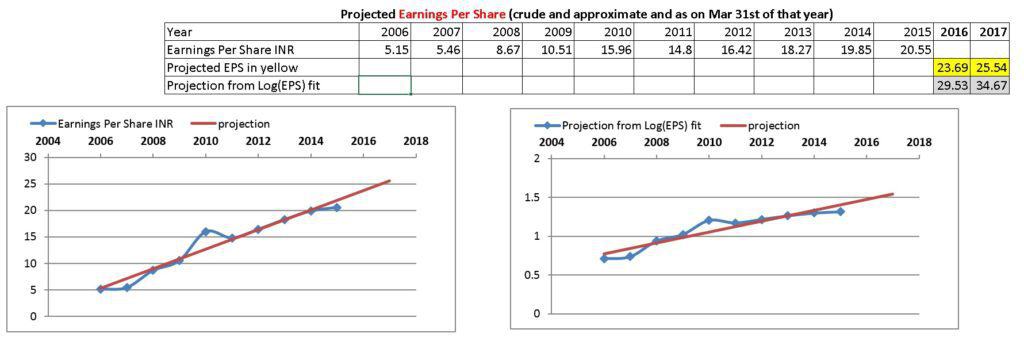
Use only for solid companies which are expected to consistently do well.
Bug fix
- Thanks to Gaurav Anand for pointing out an error in the Graham formula and Graham number sheet. This is now fixed.
How can this sheet be improved?
Please let me know additional features that can be incorporated and changes in the present format that will make the sheet useful. I would like the sheet to become more inviting.
Trivia: Version 1 was released on 25th Dec. 2014.
Download version 14th of the freefincal stock analyzer June 16th, 2019 <== latest!
Note: VR has made it necessary to login to see returns. Therefore, please do the following:
- Open blank excel
- Select Data in the menu
- Click get external data and then from web
- A browser window will open and there will annoying script error messages. Dismiss them.
- Then Go to VR online in that window and go to main page. There will annoying messages. Dismiss them.
- Click on login. If you are not able to do so. Stop the page from downloading and then click
- Login with your email (preferable) and click on remember me.
- Now you can exit the browser window and start using the screener. It should work fine now.
VR download feature is not necessary for the feature to work.