Each time the S&P 500 provides a return higher than local Indices, Indian investors want to know if they can hold US Stocks. Does this make sense? If so, how much exposure should they have?
“Should I hold international stocks in my portfolio?” is a question that investors ask when returns in the local stock markets pale. In an Indian context, this typically means “buying US stocks”. So the questions to ask are, “should I buy US stocks?”, “if yes, how much should I hold?”
After the 2008 crisis, the US markets have had moved up significantly with only two -negative annual returns: -0.7% in 2015 and -6% in 2018. Almost all other annual returns were in two digits and three 20% plus years. Dividends are not included in this! Source: macrotrends
Although the Indian markets too moved up during this period and often much more, the Sensex fell by 23% in2011; In 2015 and 2016, Sensex did not beat a savings bank account and an FD in 2018. Naturally, this would make any investor look for greener pastures. Let us find out.
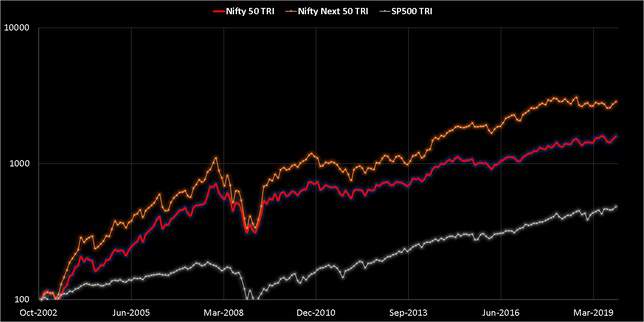
We start the analysis with a comparison of Nifty 50, Nifty Next 50 and S and P 500 (all dividends included) from Nov 2002. Unfortunately, this data set is rather small. There are several disadvantages associated with this, as discussed below. This is what we have, and we will have to work with it.
🔥Secure your future with our Robo-advisory tool trusted by over 3,500 investors and advisors. From effortless retirement planning to funding your children’s biggest dreams, turn your financial goals into reality. 🔥
The graph is in log scale, and a small portion of the S and P 500 (during the 2008 crisis) is cut off to make the rest of the plot clear.
Just by looking at this, one might be tempted to conclude that “over the long term” it makes sense for an Indian investor to stick with the Indian market. This is reasonable with the caveat that the Indian market may not grow as much and as fast as it did in the past.
Not so fast! We need to dig deeper. Please be sure to see all the graphs and read the article in full. Also, there is something missing in the above chart. The S and P 500 is in USD while the Nifty indices are in INR. So when the S and P 500 is converted to INR, we get this.
Nifty 50 vs Nifty Next 50 vs S and P 500 (in INR)
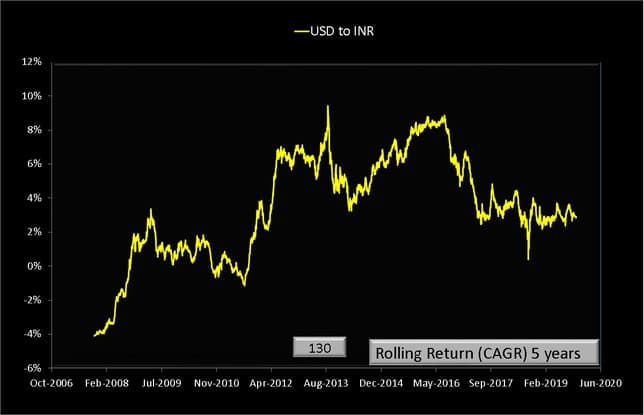
Many readers may be disappointed to note that the difference is not much between the S&P 500 and S&P500-INR. This is because the USD to INR conversion rate does not provide a significant gain over time (although it feels like it). This is the five-year rolling returns.
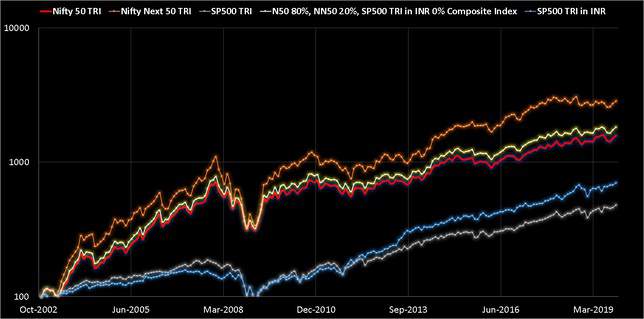
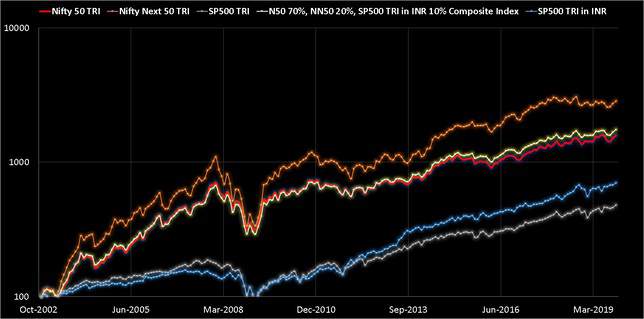
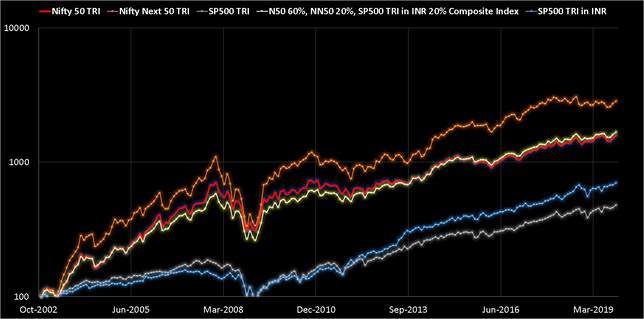
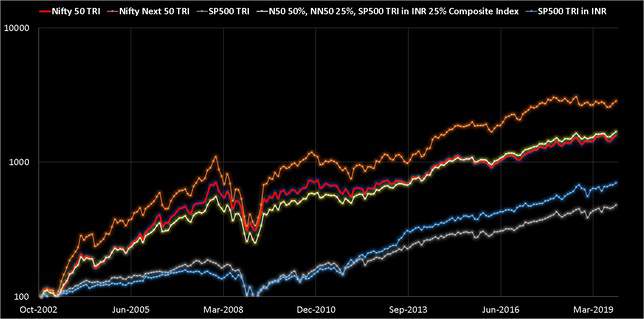
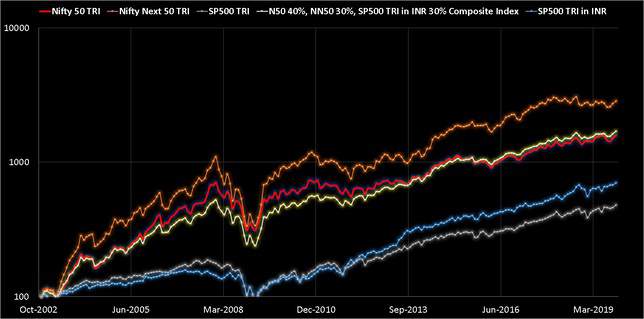
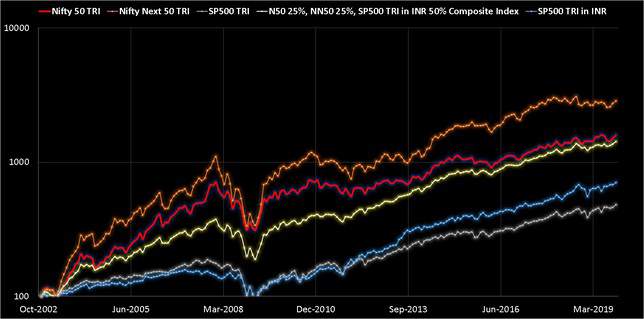
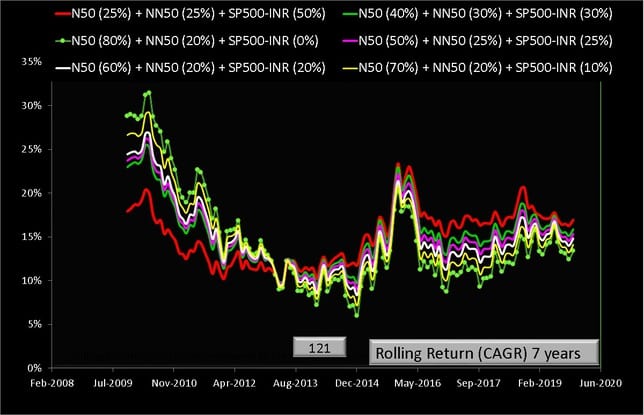
We shall ignore taxes and exit loads. The portfolios are assumed to be rebalanced each month. Look for the movement of the white line. This is the composite portfolio. The evolution of the composite portfolios is shown below. This is monthly data so some features may be missing.
We have a short window to work with here. Focus your attention on the dotted green line. That has no S&P 500 contribution. It perhaps ironic and even amusing that after the start of the late-2013 upward movement in the Indian stock market, composite portfolios have done better!
The red line with 50% of S&P 500 and 25% n50 and 25% nn50 has the lowest return spread. Based on this limited dataset, this balances return and risk well (based on a simple visual observation).
Yes, the above data suggests that “some exposure to S and P 500” will be beneficial to the investor. At the very least, it cannot hurt and will lower risk. However, there are two significant problems.
It is not easy to say “how much” is enough. Exposure to 50% of S and P 500 is simply too risky if there is a repeat of 2008. Say how about 20%? Yes, but this involves effort. Regular rebalancing ignoring taxes and exit loads. Anything lower will not help.
The second problem is, most investors who want returns, want only returns. They are either ignorant of risk management or unwilling to put in the effort and pay the taxes. The higher returns or lower risk that seems so natural in Excel is quite in reality.
What the investment options?
Funds like Parag Parikh Long Term Equity Fund handle this quite well. There is not tax or exit load outgo and rebalancing to worry about. Also, the international portfolio is not restricted to US stocks. This IMO is the best-suited option for most investors. However, exposure to the fund must be significant to make a difference. Disclosure: the author is invested. See for details: My personal financial audit 2018
Using international feeder funds will also work, the expense ratio (not considered above) can dampen returns. Investors with an eye on the Nasdaq 100 via Motilal Oswal Nasdaq 100 Fund of Fund will have to keep concentration risk in mind. See this comparison with S & P 500, for example.
Exposure to the US market can be fruitful when it moves up but can hurt badly during downturns. Therefore investors must study past risk (not the returns, especially recent) before committing money. To profit from international diversification discipline and active management is essential.
Do share this article with your friends using the buttons below.
Create a complete financial plan with our Robo-advisor!
Trusted by 3500+ investors and advisors! Use code robo25 for a 20% discount!