Last Updated on September 2, 2018 at 8:43 pm
Use this sheet to gauge the performance of equity mutual funds on a risk-adjusted basis for investment durations ranging from the past 1 year to the past 10 years. Version 6 now includes six nifty strategy indices (smart beta) for analysing mutual fund performance.
The Nifty strategic indices are tougher benchmarks for mutual funds to beat. Therefore, using these benchmarks would be a better way to separate the wheat from the chaff. A couple of these indices were also studied in detail:
- Nifty50 Value 20 Index (NV20) as a mutual fund benchmark
- Nifty Low Volatility 50: A Benchmark Index to watch out for
This version also incorporates the recently released downside protection calculator
This analyzer can be used by ALL retail investors. NO knowledge of risk and return analysis is required to use the sheet and understand the results!
🔥Secure your future with our Robo-advisory tool trusted by over 3,500 investors and advisors. From effortless retirement planning to funding your children’s biggest dreams, turn your financial goals into reality. 🔥
Subscribe for money management solutions via email! (Link takes you to our email sign-up form) Join 32,000+ readers in our community.
👉 New Tool Alert! NaviPlan: A Privacy-Focused Multi-asset Tracker and Goal Planner 👈
How to use this analyzer
- Choose the fund category.
- List all funds in that category at Value Research Online.
- Spot the funds which have been in the top 10 in terms of returns over the past 3, 5 and 10 years (3,5 alone should also do).
- Create a shortlist based on the above criterion. About 5 funds, not more.
- Analyze the funds with this sheet and look for a consistent risk-return score and consistent downside protection and invest in one of them.
- This will take you about 30 minutes or so.
Features of the risk and return analyzer
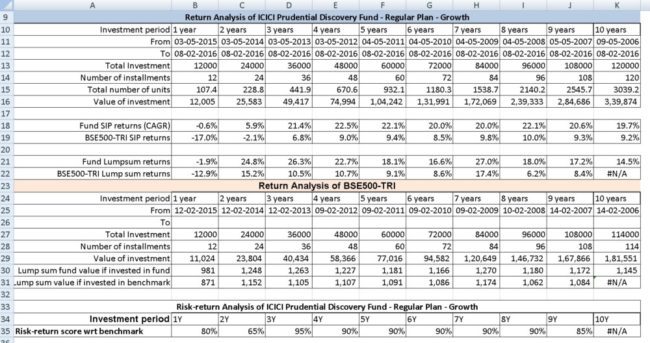
For equity mutual funds, you can determine SIP and lump sum returns for investment duration up to 10 years.
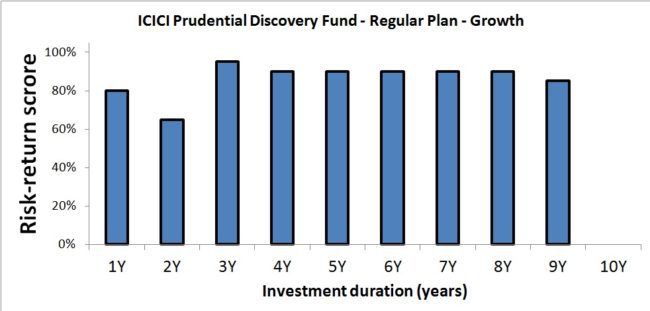
Evaluate performance taking into account the risk taken for the return achieved (13 metrics are computed. See the list here). A percentage score is assigned to the fund for each investment duration based on values of the 13 different risk/return metrics.
- Compare Fund versus benchmark. Indices available: A total of 53 Indices, including Nifty TRI, Sensex TRI, BSE 200 TRI, BSE 500 TRI,Nifty, CNX 100, CNX Mid Cap, CNX 500, Sensex, BSE Small Cap, Mid Cap, BSE 100,200, 50 etc.Indices available: A total of 47 Indices, including Nifty TRI, Sensex TRI, BSE 200 TRI, BSE 500 TRI,Nifty, CNX 100, CNX Mid Cap, CNX 500, Sensex, BSE Small Cap, Mid Cap, BSE 100,200, 50 etc.
TRI refers to total returns index. That is the index has been calculated with dividends reinvested.
The user needs to obtain them manually from the S&P website (updated up to 4th April 2016). Links for updating each index is provided in the sheet.
The TRI indices are stored in the sheet while other indices are downloaded from Moneycontrol.
The six strategic indices are:
NV20 – 20 value stock from within Nifty.
NQ30 – 30 quality stocks from NSE listing.
Alpha50 – 50 alpha generators from top 300 NSE stocks (market cap)
NDivOpp – Top 50 dividend yield stocks from top 300 NSE stocks (market cap)
NLV50 – 50 least volatile stocks from top 300 NSE stocks (market cap)
NGS15 – Top 15 growth stocks from top 50% market cap of all sectors with PB and PE greater than the Nifty.
The strategy indices also need to updated from the NSE site (updated currently up to June 30th 2016).
Benchmark recommendations:
Large Cap: Nifty Value 20 (NV20) and NIfty TRI
Mid-cap: Nifty Alpha 50 (Alpha50) and BSE 200 TRI and Nifty Mid-cap
Multi-cap: Nifty Next 50 (Jr), Nifty Low Volatility 50 (NLV50), Quality30 (NQ30) or BSE 500 TRI.
Div yield funds: Nifty Div Opp 50 (NDivOpp)
Small cap: BSE Small cap
- Compare Fund and benchmark performance wrt a risk–free rate that you choose for each investment duration
- Compare Fund and benchmark performance wrt a minimum acceptable rate that you choose for each investment duration

Read more: Understanding Upside and Downside Capture ratios
New feature: Upside and downside cagr
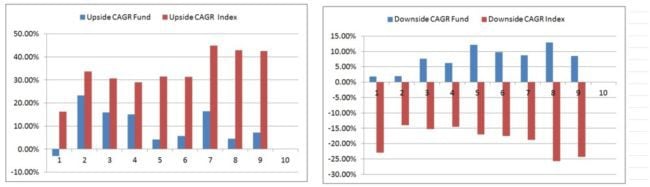
Upside CAGR is the annualized returns from monthly gains and downside CAGR, the annualized CAGR from monthly losses.
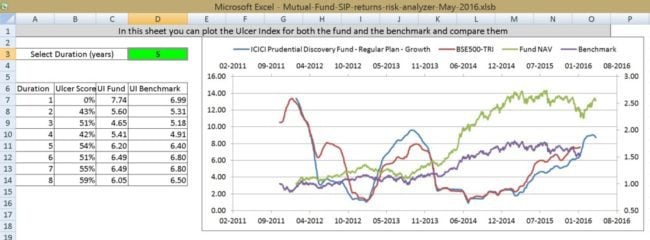
Download Version 6.0 of the mutual fund risk and return analyzer (Aug 18th 2016)
Download Version 5.0 of the mutual fund risk and return analyzer (May 5th 2016)
Download Version 4.0 of the mutual fund risk and return analyzer (Jun 18th 2015)