Last Updated on December 18, 2021 at 10:31 pm
The Nifty Low Volatility 50 Index (NLV50) is a portfolio of 50 stocks that has the least volatility among all the stocks listed at the NSE. This is referred to as a smart beta strategy.
Considering the way it is constructed, its performance (much of which is backdated) has been quite interesting and I think this can be a suitable benchmark index for multi-cap mutual funds in terms of risk-adjusted returns.
Thanks to Indraneal, who blogs at cognicrafing for helping me understand the composition of its current portfolio – 19 large-cap stocks + 30 mid-cap stocks and one small-cap.
However, The index has no specific cap or sector tilt and only depends on volatility – standard deviation of daily returns in the past year (calculated each business day).
🔥Secure your future with our Robo-advisory tool trusted by over 3,500 investors and advisors. From effortless retirement planning to funding your children’s biggest dreams, turn your financial goals into reality. 🔥
Subscribe for money management solutions via email! (Link takes you to our email sign-up form) Join 32,000+ readers in our community.
👉 New Tool Alert! NaviPlan: A Privacy-Focused Multi-asset Tracker and Goal Planner 👈
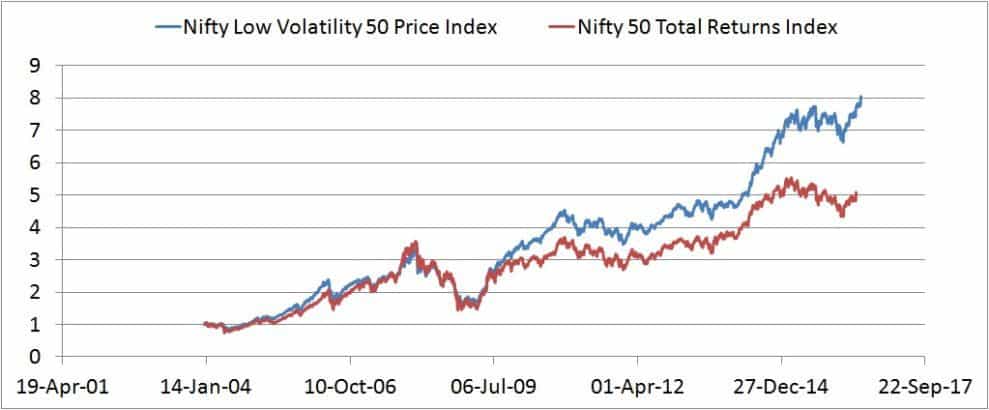
The NLV50 (backtested data, excluding dividends) managed to comfortably beat the Nifty with dividends included, but also managed to fall less during the 2008 crash.
I cannot help be amused at the NLV50 is constructed!
- Take the top 300 companies in terms of free float market cap and turnover in the last 6 months
- Ensure the companies have a
- listing history of at least 1 year
- at least 10% of total shares are available for trading (and not held by promoters, govt, trusts etc.)
- 100% trading frequency.
- positive net worth as per last annual audited report.
- Take price adjusted for corporate action and calculate the standard deviation of daily returns for the last year.
- List 50 stocks that have the lowest standard deviation (volatility).
- Stock with lowest volatility gets highest weight.
- upon quarterly review, if an index stock moves out of the top 50, but is still part of the top 100, it is not removed. This reduces churn.
- Rebalancing to preserve weights is also done quaterly.
- There is no cap or sector bias.
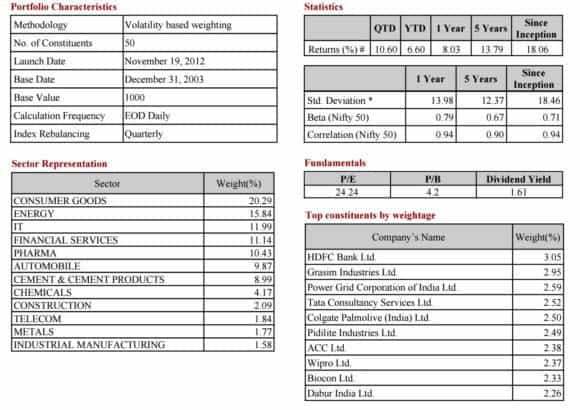
This is a snapshot from the NLV50 fact sheet. Although it has a 90%+ correlation with the Nifty, the volatiliey is a good 20-30% lower (as measured by Beta).
However, it is not a suitable index for large-cap mutual funds and indeed, none of the large-caps have managed to beat this! (Happy to share this data on request).
The mid-cap funds have managed to do better, but this is not a pure mid-cap index either. I shall test this out against all multi-cap funds once I prepare the list.
The reason I particularly like this index is performance combined with low volatility. This is a good benchmark for our equity portfolios as well.
Quantum Long Term Equity vs. Nifty Low Volatility 50
Using the Analysis: 10-year Lump sum vs 10-year SIP returns sheets, here is how Quantum Long Term Equity fares against this index.
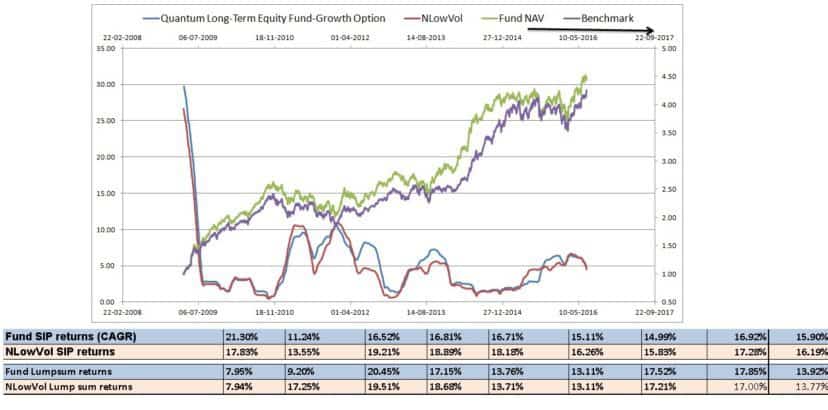
NLV50 has a lower Ulcer index than QLTE. The Ulcer index is a measure of volatility and downside risk or in other words, a measure of investor stress! Lower the ulcer index, lower the stess.
In terms of returns too, QLTE is a bit lower than NVL50. Although a bit more volatile, the fund has managed to beat the index when evaluated from Apr 3rd 2006.
To be continued ….