Last Updated on August 30, 2021 at 3:40 pm
If we invest in market-linked products like stocks, debt mutual funds, gold etc. it is a good idea to benchmark our returns with respect to the volatility associated with the instrument. This can be done with the an idea known as risk-adjusted returns.
Unfortunately, this volatility is often referred to as ‘risk’. When we refer to the instrument, risk and volatility are one and the same. When we refer to the investment then risk = volatility if the investment tenure is short (~ 5 years). For durations above that volatility leads to notional losses and risk leads to real losses – either due to fall in the instrument or due to inflation. Read more: Equity investing: How to define ‘long-term’ and ‘short-term’
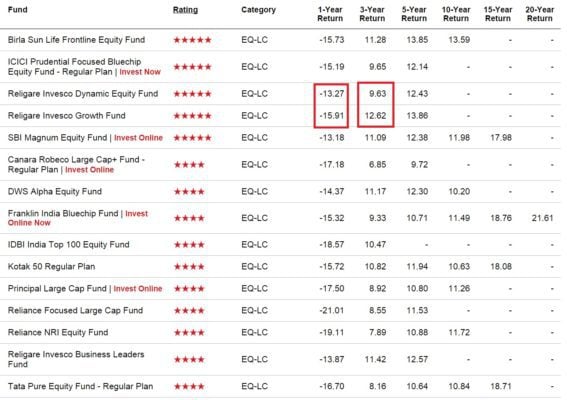
To understand the notion of risk-adjusted returns, let us dive right into an example. This is a screenshot of the Value Research SIP returns for large cap funds. The data from this is used make the Freefincal Mutual Fund Screener with SIP Returns
🔥Secure your future with our Robo-advisory tool trusted by over 3,500 investors and advisors. From effortless retirement planning to funding your children’s biggest dreams, turn your financial goals into reality. 🔥
Subscribe for money management solutions via email! (Link takes you to our email sign-up form) Join 32,000+ readers in our community.
👉 New Tool Alert! NaviPlan: A Privacy-Focused Multi-asset Tracker and Goal Planner 👈
I have sorted this in terms of star ratings (because they use risk-adjusted returns). Look at the 1Y and 3Y SIP returns of Religare Invesco funds.
A fund with 12.62% 3-year SIP is a 5-star fund. Another fund with 9.6% 3-year SIP is also a 5-star fund. Why?
Because, their risk-adjusted returns are comparable, although their returns are quite different.
Risk-adjusted return is defined as return per unit risk. This is (typically) a ratio of two quantities – return and risk(volatility).
Return is an absolute measure. Risk-adjusted return is a ratio. High return does not mean high risk-adjusted return!
In the above figure, the fund with 5-year SIP return of 12.57% is a 4-star fund! Why?
Because it took higher risk to achieve those returns.
If you like the notion, I have to be a party pooper. Popular measures of risk-adjusted returns are deeply flawed! Rating agencies use many (if not all) of such flawed measures (another reason to discard star ratings).
The root cause of the trouble is in the way volatility is measured. The most common metric is the standard deviation – the average of deviations from the average! This video may be of help: How to measure risk associated with an equity investment
What most people in the financial services fail to tell you is that the standard deviation is unfit to describe volatile instrument returns. Why?
Because these returns do not fall into a normal distribution – the only requirement for the validity of the standard deviation! Here is some proof:
- What Return Can I Expect From Equity Over the Long-term? Part 2
- Value at risk (VAR): Would you buy a car with a faulty airbag!
If the standard deviation is not valid, then any metric that uses it is also not valid.
Here are some commonly used examples of risk-adjusted return based on the standard deviation:
Sharpe Ratio
Defined as: (return – risk-free rate*)/(standard-deviation)
* return with no volatility – Value Research uses SBI 45-180 days Term Deposit Rate as the risk-free rate.
Invalid because the standard deviation is invalid!
Sortino Ratio
Defined as: (return – risk-free rate*)/(downside-deviation)
Downside deviation is nothing but the standard deviation of only negative deviations from the average. This is also known as harmful volatility.
For example, conside a set of monthly returns:
-25%, 100%, 14%, 60%, -40%, 25%.
The average is ~ 22%.
Some monthly returns are below this average (negative deviation) and some monthly returns are above this average (positive deviation).
The standard deviation uses both +ve and -ve deviations. If only the -ve deviations are considered, then we get the downside deviation. Unfortunately, that does not justify its use!
For the same reasons (albeit a bit too technical for this post), the Treynor ratio, the beta and the alpha are flawed!
I confess that I too have used these ratios extensively in the Mutual Fund Risk and Return Analyzer V 4.0
I realized about these limitations afterwards and therefore, decided to focus on downside and upside capture ratios
Also see:
- Simplify Mutual Fund Analysis with Upside/Downside Capture Ratios
- Mutual Fund Downside Protection Calculator
- Mutual Fund Downside Protection Consistency Analysis
These ratios are not direct measures of calculating returns on a risk-adjusted basis. However, they are simpler to understand and do not depend on the standard deviation.
Another indirect measure of risk-adjusted return is the Ulcer Index. This is an alternative measure of volatility. Read more: Mutual Fund Analysis With the Ulcer Index
You can calculate this with the mutual fund risk and return analyzer.
Conclusion: Risk-adjusted return is a measure of return per unit risk. Although it is useful, commonly used metrics are flawed. Indirect, but simpler to understand measured can be considered as an alternative.